| Back To Top |
 |
 |
||
|
 |
||
 |
 |
||
 |
 |
||
|
.....
 |
||
 |
 |
||
 |
 |
||
Some basic rules to follow while trading Breakout Patterns
Here you will find information about the various chart patterns and
technical indicators we use at Breakpoint Trades. The goal here wasn’t to
write a book or re-invent the wheel, but to cut out the fluff and include
only the most important and useable information. This section contains very
useful and important information not found on many other trading websites:
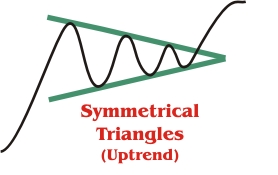
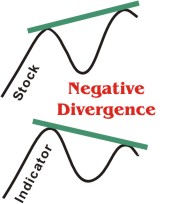
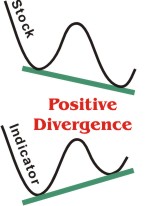
Chart Patterns:
Here you will find valuable information on chart patterns that are the
staple of technical analysis and the ones we at Breakpoint Trades use every
day. You will also find a basic description of the chart pattern, along with
many examples of stocks that exhibit good examples of these patterns. It is
my belief that one learns by seeing lot’s of examples, rather than one or
two ‘text book’ examples. Therefore, I will be continually adding the best
real chart examples that have been profiled on Breakpoint Trades along with
others that I might find over time.
Also, you will find something here that is very useful - statistics on
chart patterns! For instance, have you ever wondered what is the probability
that an ascending triangle will breakout to the upside? What is it’s failure
rate? What is the average percent rise I can expect, or how many ascending
triangles on average will hit their price targets and in what time frame?
Knowing the statistics and probability of chart patterns will give you, the
trader, a very powerful advantage. For instance, if you know the statistics,
you will know what type of money management system you should use, i.e. you
can incorporate various investment strategies to vary your investment by
progession or regression. Also, knowing the statistics makes it easier to
stick to a system to maximize your profits by trading objectively and not
fall prey to one’s emotion. Most novice traders lose money because they hold
on to losers too long and sell their winners too quickly. This problem stems
from uncertainty. Statistics can help take away this uncertainty and help
you trade more objectively.
All the statistical information for the chart patterns is referenced form the book: Encyclopedia of Chart Patterns by Thomas N. Bulkowski - Publisher: John Wiley & Sons. Click the title to buy this excellent book. I recommend everyone buy this book. It does in-depth statistical analysis on 50 different chart patterns over a 6 year period from 1991 to 1996. Please note that the various chart sections attempt to summarize the most important statistical information in Bulkowski's book, and are not a replacement for the huge amount of information found in the book. Also the statistics are probably biased to the time frame of study, and may not be totally applicable to today, however they are probably close enough to be very useful.