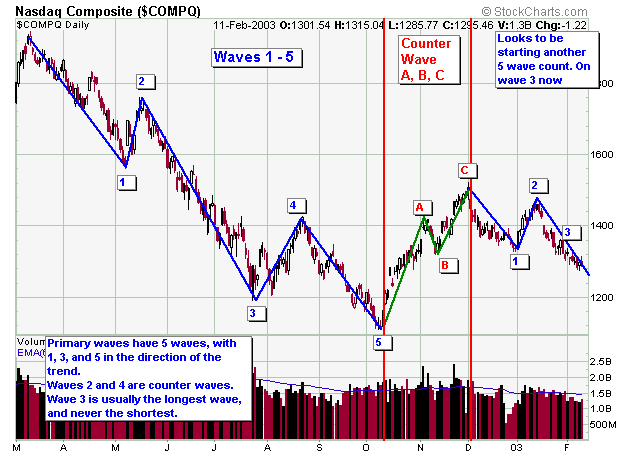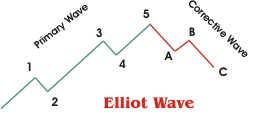
Elliot Wave theory is an outgrowth of the original technical market analysis of Dow Theory. The Elliott Wave Theory is named after Ralph Nelson Elliott. R.N. Elliott who concluded that the movement of the stock market could be predicted by observing and identifying a repetitive pattern of waves. Elliot Wave theory postulates that the market movements of each cycle are defined and predictable. There are two types of waves, impulse (or primary) and corrective. Primary waves consist of 5 waves and move in the trend of the market and can be bullish or bearish. Waves 1, 3 and 5 move with the primary trend, while waves 2 and 4 move counter to the primary trend. The corrective wave consists of 3 waves usually denoted A, B, C. Generally, Correctie waves form after a 5 primary ends and vice versa.
Some rules for a 5 wave primary count:
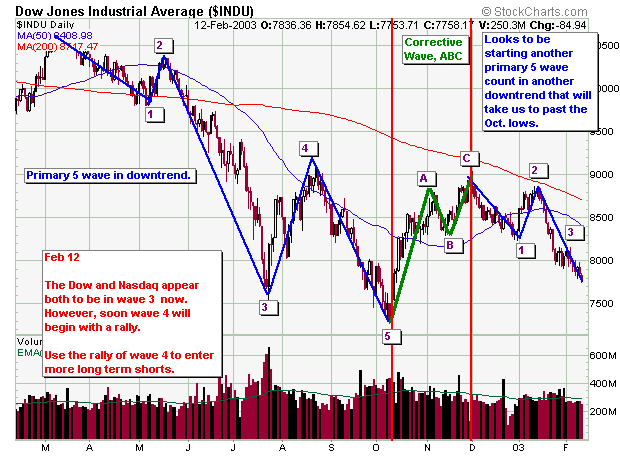
Note that Elliot Wave theory is a highly subjective form of technical analysis. Each practitioner may use a different starting point for the wave count they use. The complexity of Elliot Wave theory has made it difficult for many investors to use reliably. However, this doesn't mean they should not be used or observed. I am not an Elliot wave master, but I will use them whenever they are obvious as in the Nasdaq and Dow examples below. If I have any doubt about the wave count for a particular stock or index, then I will not use it, but will use tradition forms of Technical Analysis such as chart patterns, trendlines, etc.