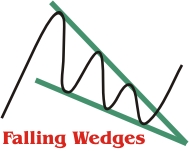
Falling Wedges are bullish biased patterns that are characterized by a
series of lower highs and lower lows that converge in a downward pattern.
Two trendlines can be drawn connecting the highs and the lows resulting in a
downward right-angled sloping triangle. These downward trendlines should be
tested several times with the most reliable formations touching the
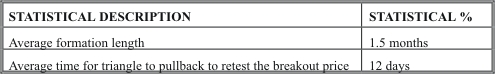
trendlines at least 5 times. The time length or duration of the pattern
should be at least three weeks, anything shorter is probably a Pennant. The
volume tends to decrease during the formation of the pattern
If one misses the breakdown, he/she may have a second chance to short the
stock on a retest or pullback to the pattern – this happens about half the
time per the statistics below. Upside breakouts generally occur about 2/3 of
the way through the pattern to the apex. Also note that upside breakouts do
not need to be confirmed with high volume, as stocks can fall under their
own weight. Falling Wedges can are prone to premature breakouts either up or
down as is any pattern and this does not signal the end to the pattern. In
fact, statistical information from “Encyclopedia of Chart Patterns” by
Thomas N Bulkowski, shows that 27% of Falling Wedges are subject to a
premature breakdown. If a Rising Wedge is broken to the upside via a
Breakaway Gap, the likely hood of a nice run-up is enhanced and I would
consider this have an even better chance of success. A generic price target
would be a rise to the top of the pattern – however many breakouts find
temporary resistance at the 38.2% Fibonacci retracement level so be aware of
this as they are mostly temporary. Also note that while these patterns can
be very profitable, they are quite rare with only 132 examples found in 797
stocks from 1991 – 1998, “Encyclopedia of Chart Patterns” by Thomas N
Bulkowski.
All the statistical information for the chart patterns is referenced form the book: Encyclopedia of Chart Patterns by Thomas N. Bulkowski - Publisher: John Wiley & Sons. Click the title to buy this excellent book.
Statistics for Falling Wedges based on a population of 132 examples in 797
stocks from 1991 - 1998
General Statistics for Falling Wedges
| STATISTICAL DESCRIPTION |
STATISTICAL %
|
| Failure rate |
10%
|
| Failure rate if waited for upside breakout |
2%
|
| Average rise after upside breakout |
43%
|
| Most likely rise after upside breakout |
20 - 30%
|
| Average # that meet price targets |
88%
|
| Average # that pulled back to retest the triangle bottom |
47%
|
| Average breakout distance to apex |
69%
|
| Premature breakouts |
27%
|