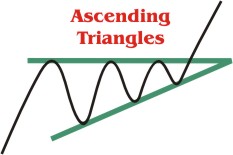
Ascending triangles are bullish biased patterns that are characterized
by a series of at least two higher lows along with a series of at least two
highs that top out or find resistance at around the same price. The higher
lows can be connected with an uptrend line, while the highs can be connected
with horizontal or near horizontal line that forms the resistance area. Keep
in mind that ascending triangles MUST have at least two minor highs forming
the top trendline and at least two minor lows forming the bottom trendline
to be valid. Many people incorrectly identify ascending triangles, for
instance consider a pattern that has 3 higher lows but only has 1 high. This
is not an ascending triangle even though it might look exactly like one.
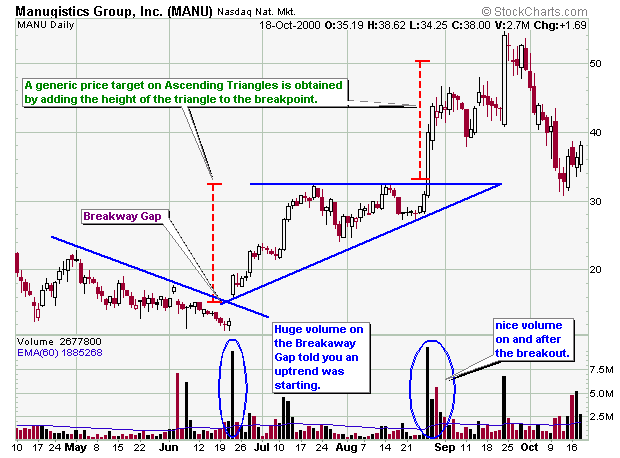
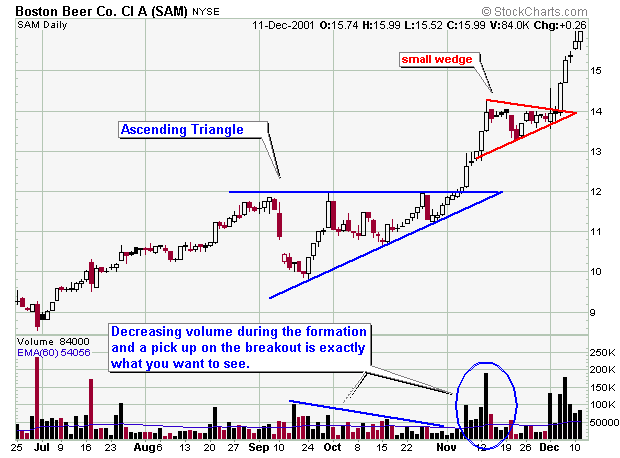
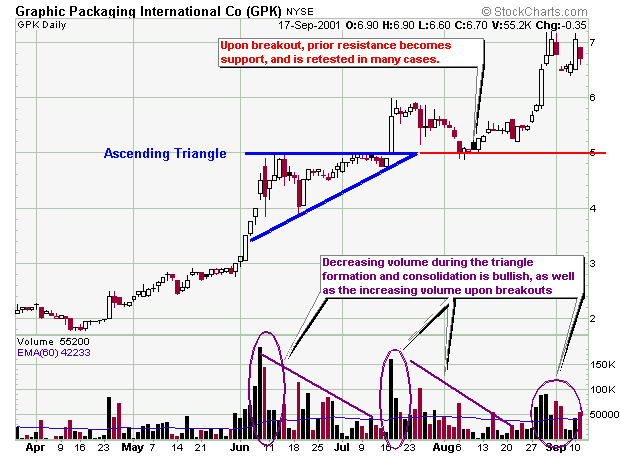
The volume tends to decrease during the formation of the pattern. A
generic price target can be calculated by measuring the height of the
triangle and adding it to the horizontal resistance line that forms the top
of the pattern.
All the statistical information for the chart patterns is referenced form the book: Encyclopedia of Chart Patterns by Thomas N. Bulkowski - Publisher: John Wiley & Sons. Click the title to buy this excellent book.
Statistics: based on a population of 725 examples in 500 stocks from 1991 - 1996.
| STATISTICAL DESCRIPTION |
STATISTICAL %
|
| Failure rate |
32%
|
| Failure rate if waited for breakout |
2%
|
| Average rise after breakout |
44%
|
| Most likely rise after breakout |
20%
|
| Average decline of failed formations |
21%
|
| Average # that meet price target by height measurement |
89%
|
| Average # that pulled back |
58%
|
| Average breakout distance to apex |
63%
|
| Premature breakouts |
25%
|
Obviously, from the statistics above, your risk is lowered by 30% if you wait to buy an ascending triangle after it triggers by breaking out or breaking resistance.
Now that you understand something about descending triangles, it's time for some real time examples. Please note that I will be adding more examples as I find them.
| STATISTICAL DESCRIPTION |
STATISTICAL
|
| Average time for price to pullback and retest the breakout price |
15 days
|
| Average time for price to start the pullback |
13 days
|
| Average time for successful breakouts to achieve their ultimate high |
45% hit their highs in less than 3 months
35% hit their times in-between 3 - 6 months 19% hit their highs in more than 6 months later Average time is 6 months to hit their highs |
Surprise Findings:
Even though the average time for pullback completion takes about 13 – 15
days, note that pullback will begin much sooner than this, such as only a
few days after breakout. Therefore, if you buy an ascending triangle after
it breaks out, don’t ‘freak out’ if it starts to pullback, or if the volume
is low – per the volume statistics above.
For swing trading, it is so important to let your winners run and sell
you losers quickly. Most novice traders hold on to their losers too long.
How does this happen??? After a trader has a string of losses, he/she
surrenders to emotion which causes him/her to lose objectivity. In this
example, once the trader surrenders to emotion, he/she will feel a
psychological need to quickly lock in some profits to feel better i.e. the
trader does not let his winners run.
Do not fall into this destructive trap – sell your losers quickly and let
your winners run – trade objectively, not emotionally. It’s also a lot
easier to let a position run than constantly trading in and out of positions
quickly – at least it is for me and is the reason I do not day trade.
Chart Examples