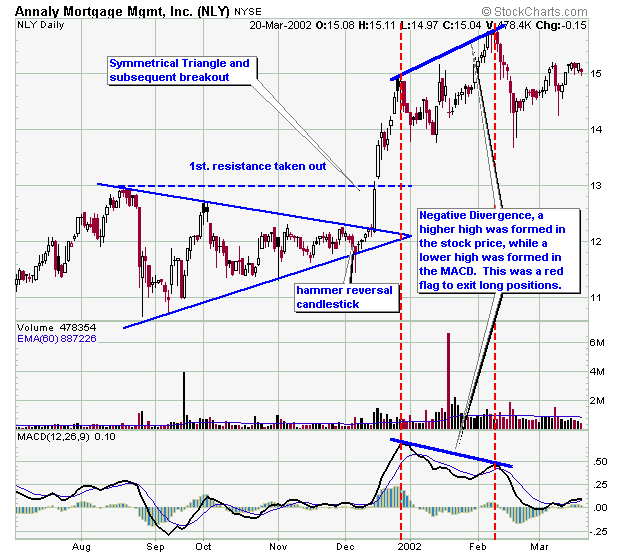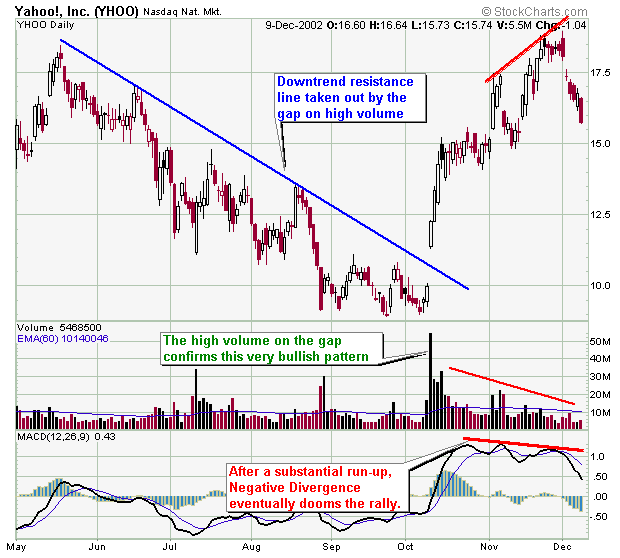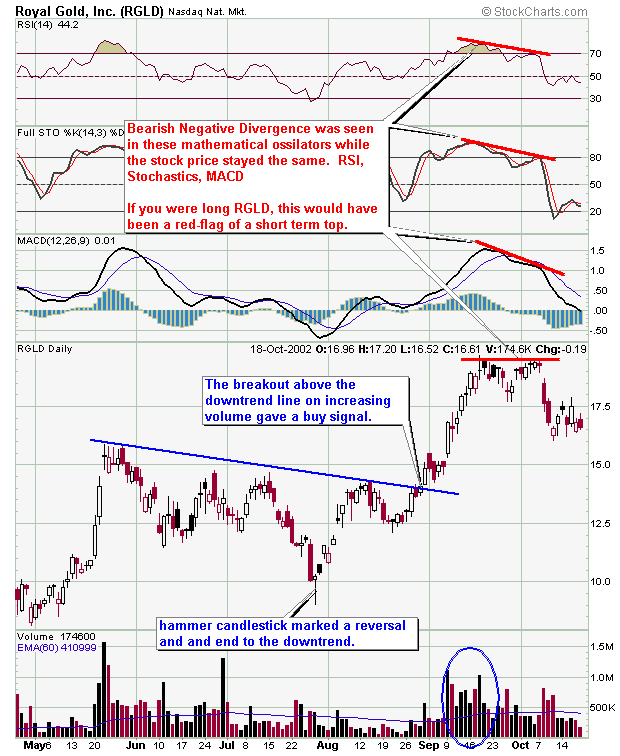
Normally stocks and their respective mathematical indicators confirm one another. For example, usually when a stock forms a higher high, so does one of it's mathematical indicators, and vise versa. However, sometimes a divergence takes place where the stockprice and the indicators do not match. Technical divergence can be thought of as an anommoly - in other words, the divergence can only sustain itself so long before the indicators and the stock price match again. Always be on the lookout for technical divergence especially after a stock has been in an extended uptrend as it can be a good warning that a stock is going to change direction. Thus, Negative Divergence is usually seen after a stock has run-up from a prior chart pattern that has broken out.
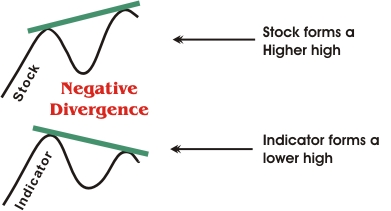
Negative Divergence is a consition where a stock or security forms a higher high, but a mathematical indicator (such as the MACD, Stochastics, etc.) forms a higher low - hence, a divergence takes place. Traders should look for Negative Divergence when they are holding short positions as a signal to cover them. Positive divergence is very useful in that it often signals the end of a decline and /or buying opportunities well before the other more common chart patterns.
Now it's time for some examples. Please note that I will be adding more examples as I find them.