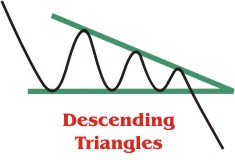
Descending triangles are bearish biased patterns that are characterized
by a series of at least two lower highs along with a series of at least two
lows that stop or find support out at around the same price. The lower highs
can be connected with a downtrend line, while the lows can be connected with
horizontal or near horizontal line that forms the support area. Keep in mind
that descending triangles MUST have at least two minor highs forming the top
trendline and at least two minor lows forming the bottom. Many people
incorrectly identify descending triangles, for instance consider a pattern
that has 3 lower highs but only has 1 low – this is not a descending triangle
even though it might look exactly like one.
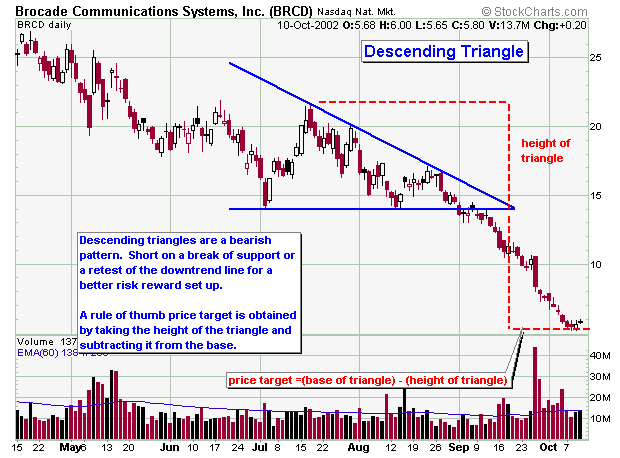
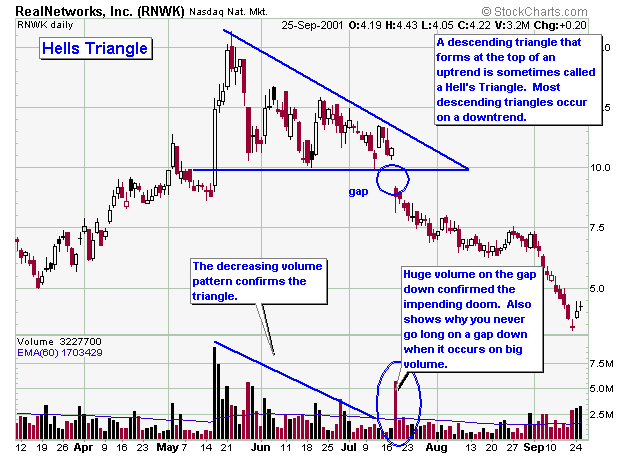
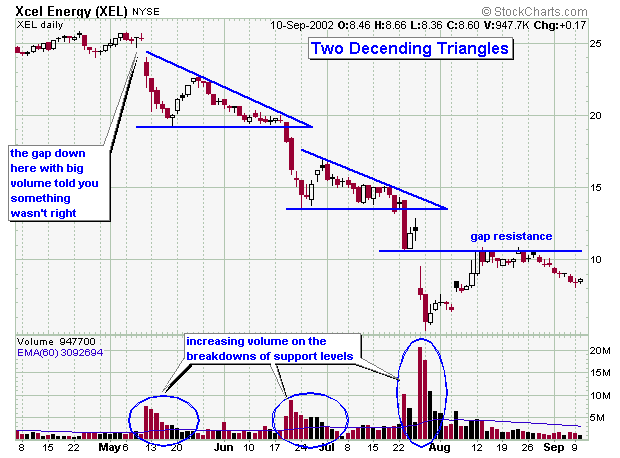
The volume tends to decrease during the formation of the pattern. A generic
price target can be calculated by measuring the height of the triangle and
subtracting it from the horizontal support line that forms the bottom of the
pattern.
Below are two tables of statistical information from the book “Encyclopedia
of Chart Patterns” by Thomas N Bulkowski
Statistics: based on a population of 689 examples in 500 stocks from 1991 - 1996.
| STATISTICAL DESCRIPTION |
STATISTICAL %
|
| Failure rate |
45%
|
| Failure rate if waited for downside breakout |
4%
|
| Average decline after downside breakout |
19%
|
| Most likely decline after downside breakout |
10 - 20%
|
| Average # that meet price target by height measurement |
67%
|
| Average # that pulled back to retest the breakpoint |
64%
|
| Average breakout distance to the apex |
69%
|
| Premature downside breakouts |
22%
|
General Statistics for Descending Triangles that fail or break to the upside
| STATISTICAL DESCRIPTION |
STATISTICAL %
|
| Average rise of failed formations |
42%
|
| Average # that pulled back to retest the breakpoint |
39%
|
Now that you understand something about descending triangles, it's time for some real time examples. Please note that I will be adding more examples as I find them.