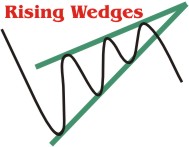
Rising wedges are bearish biased patterns that are characterized by a
series of higher highs and higher lows that converge in an upward pattern. Two
trendlines can be drawn connecting the highs and the lows resulting in an
upward sloping triangle. These upward trendlines should be tested several
times with the most reliable formations touching the trendlines at least 5
times. The time length or duration of the pattern should be at least three
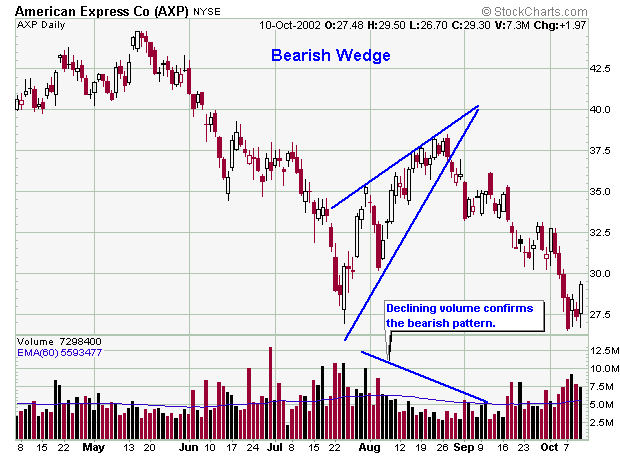
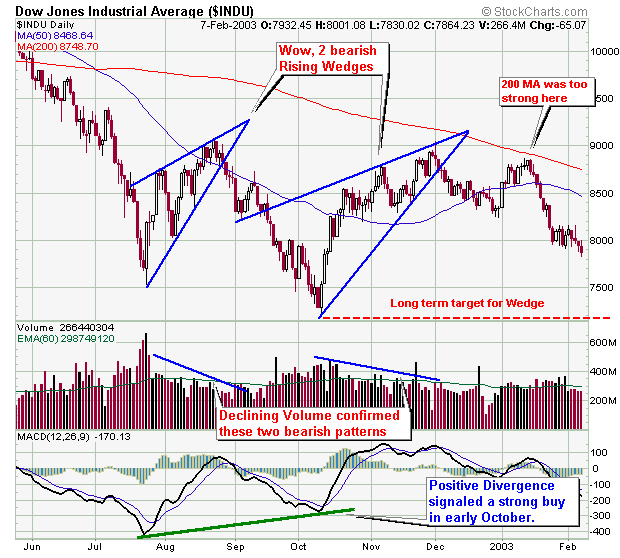
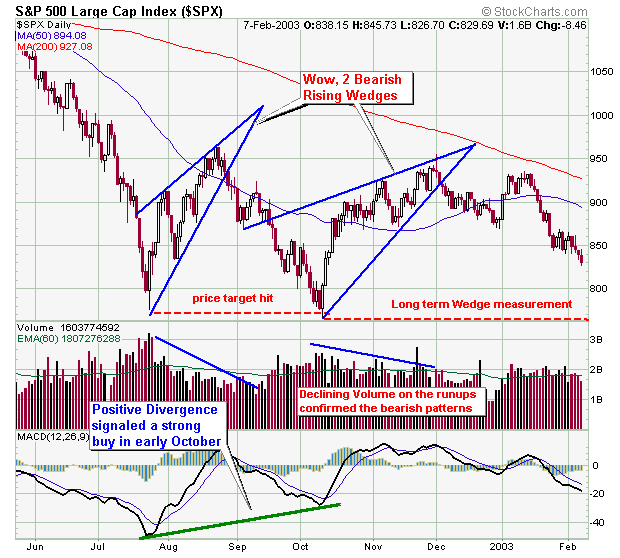
weeks, anything shorter is a pennant. The volume tends to decrease during the
formation of the pattern.
Rising wedges should only be shorted once a downside breakout has occurred
as this lowers the risk substantially – see the table of statistics below. If
one misses the breakdown, he/she may have a second chance to short the stock
on a retest or pullback to the pattern – this happens about half the time per
the statistics below. Downside breakouts generally occur about 2/3 of the way
through the pattern to the apex. Also note that downside breakouts do not need
to be confirmed with high volume, as stocks can fall under their own weight.
Rising Wedges can are prone to premature breakouts either up or down as is any
pattern and this does not signal the end to the pattern. However, if a a
breakaway gap forms whereby the stock gaps up out of the pattern, this ends
the pattern. A generic price target would be a fall to the bottom of the
pattern, however some wedges may find support at one of the three Fibonacci
numbers of 38.2, 50, and 62.8% - however the 38.2 and 50% levels seem to be
the most like place to bounce.
All the statistical information for the chart patterns is referenced form the book: Encyclopedia of Chart Patterns by Thomas N. Bulkowski - Publisher: John Wiley & Sons. Click the title to buy this excellent book.
Statistics: based on a population of 179 examples in 500 stocks from 1991 - 1996.
| STATISTICAL DESCRIPTION |
STATISTICAL %
|
| Failure rate |
24%
|
| Failure rate if waited for downside breakout |
6%
|
| Average decline after downside breakout |
19%
|
| Most likely decline after downside breakout |
15%
|
| Average # that meet price target |
63%
|
| Average # that pulled back to retest the breakpoint |
53%
|
| Average downside breakout distance to the apex |
61%
|
| Premature downside breakouts |
22%
|
Based on the statistics above it is obviously best to wait for the
downside breakout confirmation before going short.
The other things that stand out is the low “most likely” decline of 15%.
However, I wonder if this number is biased to the time from of study or 1991 -
1996. During this time period, there were periods of big declines, however the
general market trend was up in contrast to the total market meltdown we have
seen in the last few years. Therefore I wonder the Rising Wedge pattern would
have performed better with contemporary data.
The number showing a downward volume trend 74%. Therefore, the majority of Rising Wedges have a downward volume trend as do most technical patterns, so this is not surprising.
| STATISTICAL DESCRIPTION |
STATISTICAL TIME
|
| Average formation length |
1.5 months
|
| Average time for triangle to pullback to restest the breakout price |
10 days
|
| Average time for successful breakouts to achieve their ultimate high |
Average time is 2.5 months to hit their highs
|
Even though the average time for pullback completion takes about 10
days, note that pullback will begin much sooner than this, such as only a few
days after breakout. Therefore, if you short a Rising Wedge after it breaks
down, don’t ‘freak out’ if it starts to pullback, or if the volume is low –
per the volume statistics above.
For swing trading, it is so important to let your winners run and sell you
losers quickly. Most novice traders hold on to their losers too long - why
does this happen??? After a trader has a string of losses, he/she surrenders
to emotion which causes the trader to lose objectivity. In this example, once
the trader surrenders to emotion, he/she will feel a psychological need to
quickly lock in some profits to feel better to make up for the losses i.e. the
trader does not let his winners run.
Do not fall into this destructive trap – sell your losers quickly and let
your winners run – trade objectively, not emotionally. It’s also a lot easier
to let a position run rather than constantly trading in and out of positions
quickly – at least it is for me and is the reason I do not day trade.
Now that you understand something about descending triangles, it's time
for some real chart examples. Please note that I will be adding
more examples as I find them.