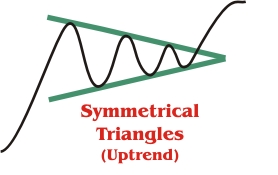
Symmetrical triangle tops are neutral biased patterns that are
characterized by a series of at least two lower highs along with a series of
at least two higher lows that converge towards a point. The series of lows
and highs can be connected with two trendlines that intersect to form a
point or apex, with both the upward sloping and downward sloping lines
having similar slopes. A coil is a spring that holds a large amount of
energy that can be released all at once, hence Symmetrical Triangles are
somtimes called coils because of their shape and tendendcy to produce large
percentage price movements in a short period of time.
The volume tends to decrease during the formation of the pattern. A
generic price target can be calculated by subtracting the lowest low from
the highest high and subtracting or adding this value to the apex or point
of the triangle. Symmetrical Triangles are more reliable if they do not
breakout at the apex, but do so roughly 3/4 of the way through the pattern,
this is supported by the statistics below. Symmetrical Triangles that go all
the way to the apex tend to have a high failure rate and and little of a
coil effect.
Below is a table of statistical information from the book Encyclopedia of Chart Patterns by Thomas N. Bulkowski - Publisher: John Wiley & Sons
Statistics: based on a population of 162 upside breakout examples and 92 downside breakouts in 500 stocks from 1991 - 1996.
Some general stats for Symmetrical Triangles that breakout to the upside.
| STATISTICAL DESCRIPTION |
UPSIDE BREAKOUT STATISTICAL %
|
| Failure rate |
5%
|
| Average rise after the breakout |
37%
|
| Most likely rise after downside breakout |
20%
|
| Average % that meet price target by height measurement |
89%
|
| Average % that pulled back after the breakout |
58%
|
| Average breakout distance to apex |
78%
|
| Premature breakouts |
14%
|
Some general stats for Symmetrical Triangles that break to the downside.
| STATISTICAL DESCRIPTION |
UPSIDE BREAKOUT STATISTICAL %
|
| Failure rate |
6%
|
| Failure decline after the breakout |
20%
|
| Most likely decline after downside breakout |
15%
|
| Average % that meet price target by height measurement |
62%
|
| Average % that pulled back after the breakout |
59%
|
| Average breakout distance to apex |
79%
|
| Premature breakouts |
19%
|
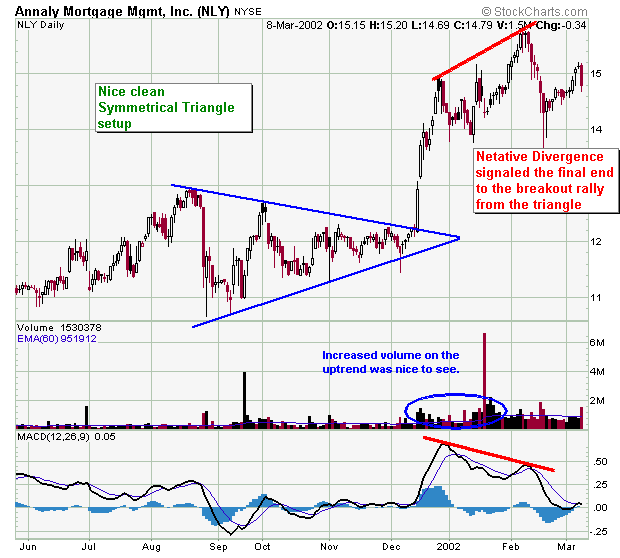
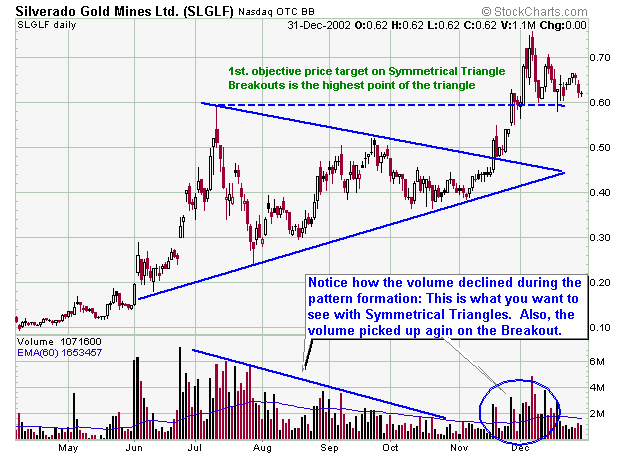
Now that you understand something about descending triangles, it's time for some real chart examples. Please note that I will be adding more examples as I find them.


