Why is this important you ask? Well, in technical analysis, we often use trendlines to identify which way a stock or index is trending. For instance, trendlines tell you if a stock is in an uptrend or downtrend, they also indicate support and resistance zones, as well as identifying important stock patterns such as triangles, flags, pennets, etc. When a stock has had a large price movement in a given period of time (i.e. a parabolic price move) it becomes difficult to draw meaningful trendlines. When a stock’s price goes parabolic, it means that the price moves either up or down in a curve at an ever increasing slope, until eventually it is moving almost straight up or down and forms a pattern much like a half circle or half moon. In other words, the stock price starts at almost a zero degree slope until it reaches almost a 90 degree slope. In science, when data is plotted from an experiment, if often does the same thing. Scientists use logarithmic charts to make the curve a straight line so that they can measure the slope and get an equation. In technical analysis, the log charts do the same thing by taking away the curve in the price movement so that straight lines, or trendlines, can be drawn to connect highs and lows.
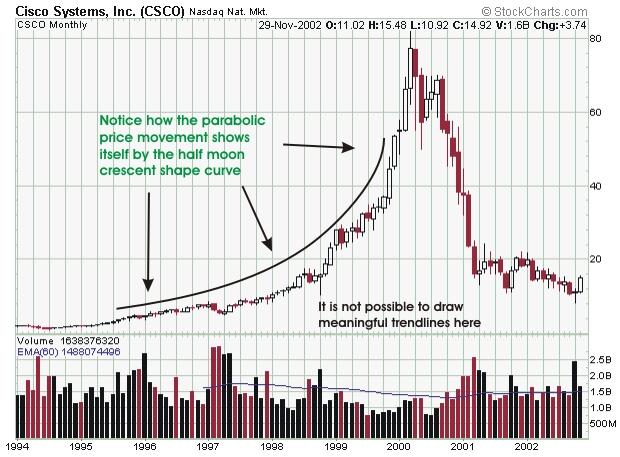
Cisco System (CSCO) is perfect example of this phenomenon and illustrates the
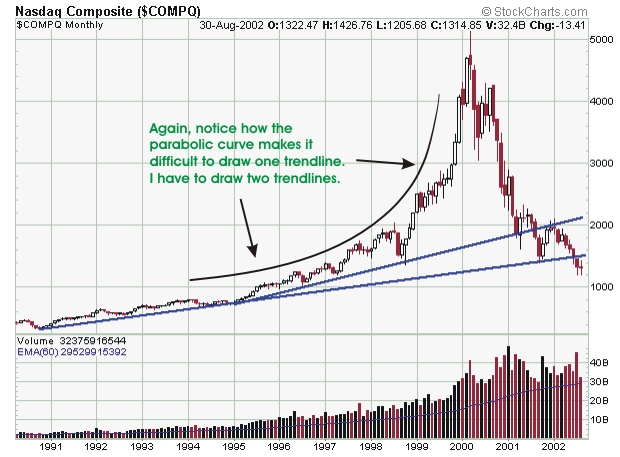
need to use a logarithmic chart. Below is a multi year linear chart of CSCO.
Notice that it is difficult to draw meaningful trend-lines on this chart
because of the half-moon shaped curve from the parabolic movement in price
over this time frame. Thus, the chart needs to be plotted on a logarithmic
scale to give us meaningful data.
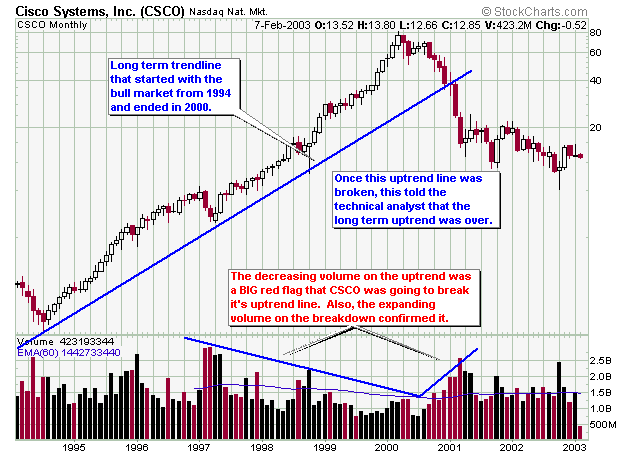
The chart below is a re-plot of the above chart over the same time fame, but using a logarithmic scale, and is a great example of a stock that needs to be plotted on a log scale. Notice that it is now easy to draw clearly defined trendlines, where this wasn’t possible on the linear chart of CSCO over the same time frame. On the chart of CSCO, we can see the clearly defined uptrend that started in 1994 that ended in 2000. Next, a very bearish descending triangle formation is in the process of forming. None of this very useful information could be seen with the linear chart over the same time frame.
![]()
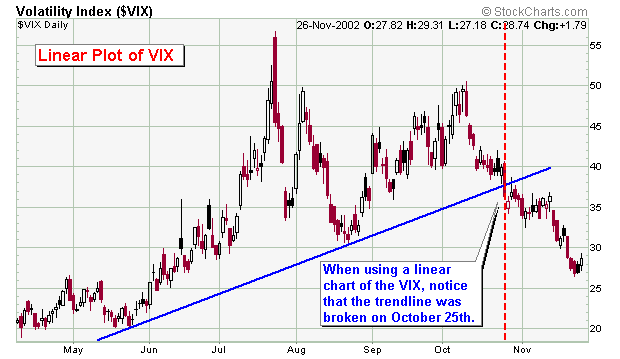
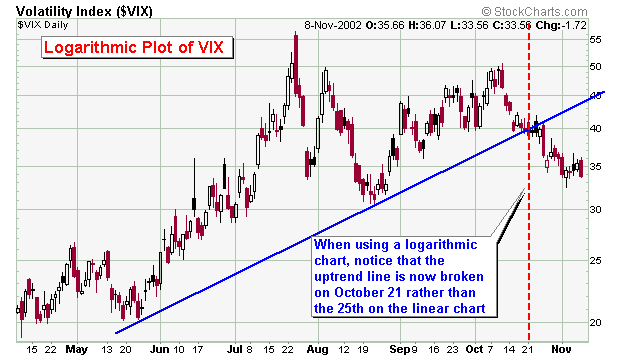
Usually on daily charts with normal price movements, you do not see a difference between Linear and Logarithmic charts. However, the two below charts demonstarte that once in a while you can come to different conclusions when using logarithic vs. linear charts. This difference is enough to cause concern because with one type of plot, you think you broke a trendline or stock pattern, but on a different plot, you haven't.
In conclusion, before trading a stock, I will usually check both the linear and log charts first.