Normally stocks and their respective mathematical indicators confirm one another. For example, usually when a stock forms a lower low, so does one of it's mathematical indicators, and vise versa. However, sometimes a divergence takes place where the stockprice and the indicators do not match. Technical divergence can be thought of as an anommoly - in other words, the divergence can only sustain itself so long before the indicators and the stock price match again. Always be on the lookout for technical divergence as it can be a good warning that a stock is going to change direction.
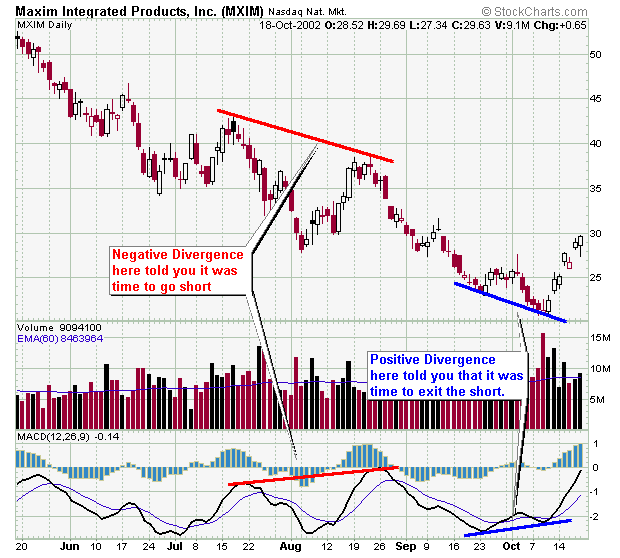
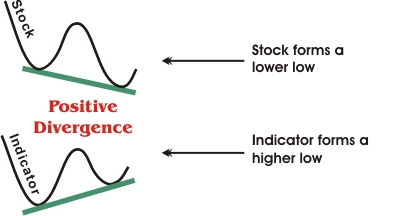
Positive Divergence is a consition where a stock or security forms a lower low, but a mathematical indicator (such as the MACD, Stochastics, etc.) forms a higher low - hence, a divergence takes place. Traders should look for positive divergence when they are holding short positions as a signal to cover them. Positive Divergence is useful in that it often signals the end of a decline and /or buying opportunities well before the other more common chart patterns.
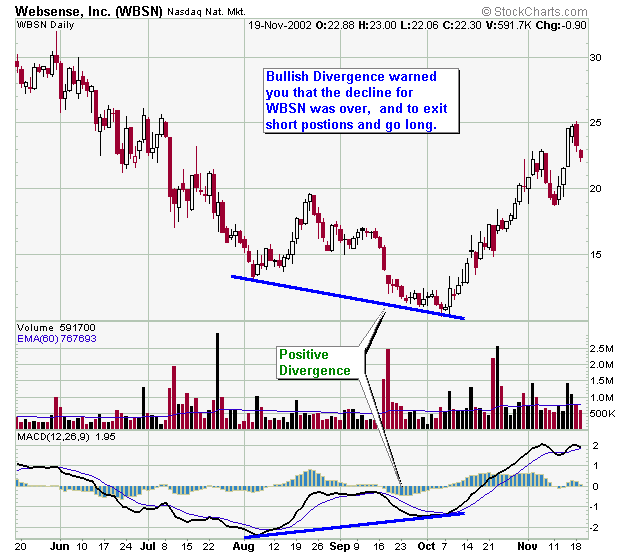
There are many stocks that formed positive divergence technical patterns in
early to middle October 2002 that signaled a buying opportunity and was a
warning to anyone holding shorts to cover their shorts and go long.
Chart Examples
Now it's time for some examples. Please note that I will be adding more examples as I find them.
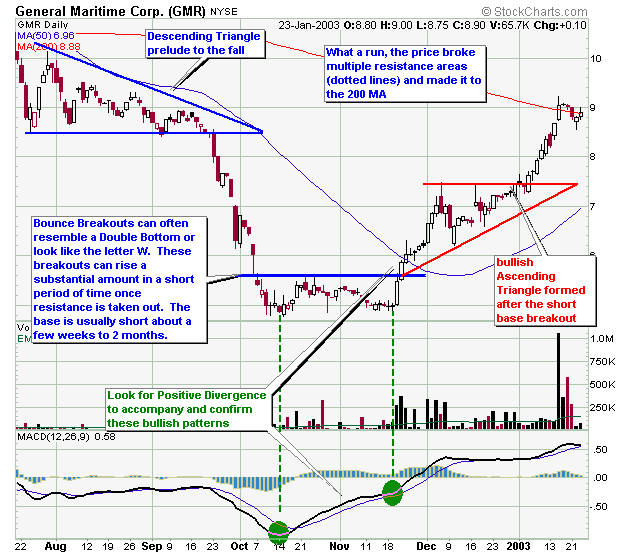
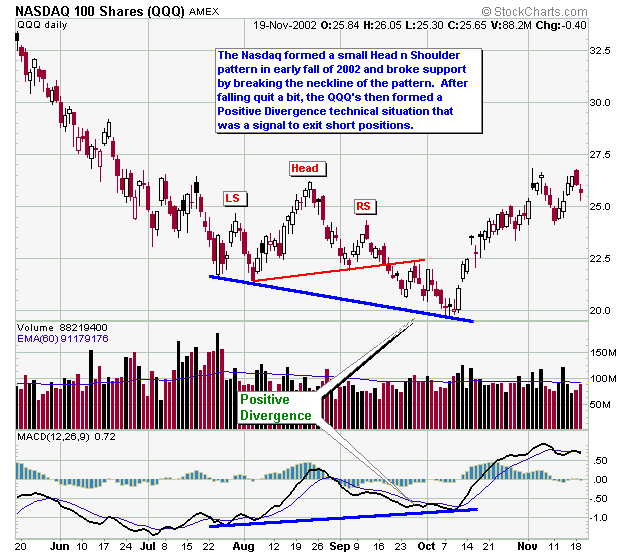
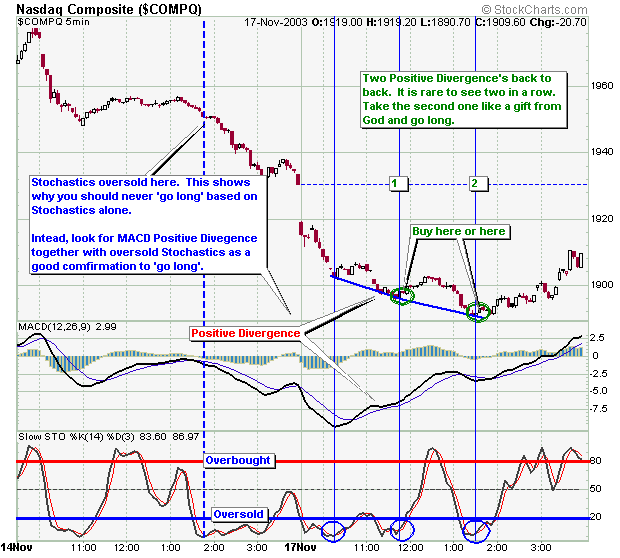
Afterwords, a nice downtrend ensued that rewarded traders who went
short the tech stocks. However, after the fall, a positive divergence formed
whereby the Nasdaq made a lower low, but the MACD made a higher low. This
signaled the astute technical trader to exit his shorts.
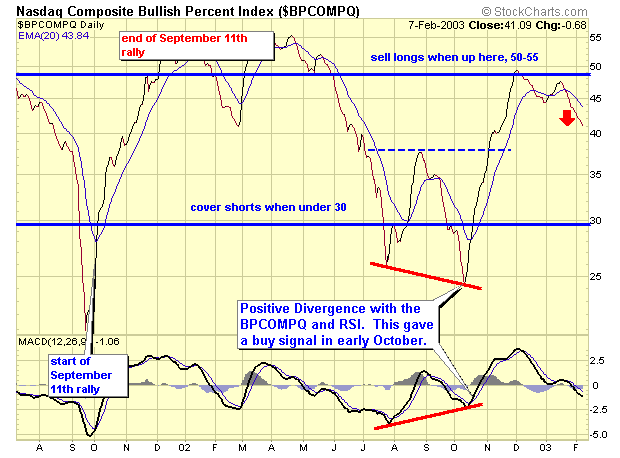
This example shows Positive Divergence in the BPCOMPQ in October 2002 which also confirmed the divergence seen in many other stocks at the time. This positive divergence signaled the start of a powerful rally that started in early October and ended in late November.
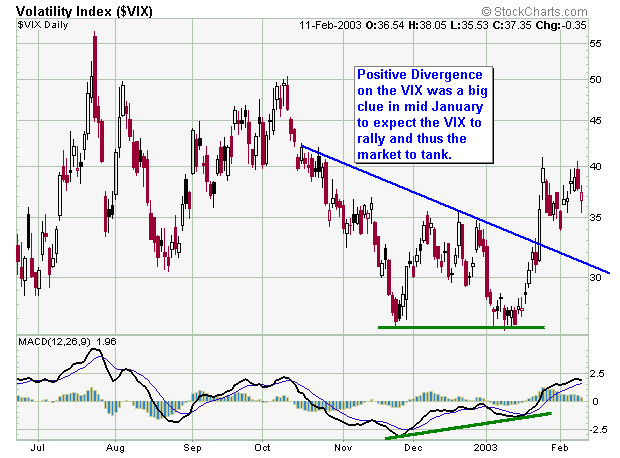
Positive Divergence in the VIX was a clue that the VIX was going to rally and
the market to tank.