Accumulation Distribution
Accumulation Distribution tracks the relationship between price and volume and acts as a leading indicator of price movements. It provides a measure of the commitment of bulls and bears to the market and is used to detect divergences between volume and price action - signs that a trend is weakening.
Accumulation Distribution is an enhancement of the On Balance Volume indicator. It first compares opening and closing prices to the trading range for the period, the result is then used to weight the volume traded.
Trading Signals
The strongest signals on the Accumulation Distribution are divergences:
-
Go long when there is a bullish divergence.
-
Go short when there is a bearish divergence.
Stop-losses should be placed below the most recent low (when going long) and above the latest high (when going short).
EXAMPLE
Microsoft is plotted with ![]() Accumulation Distribution. Divergences are shown by
Accumulation Distribution. Divergences are shown by ![]() trendlines.
trendlines.
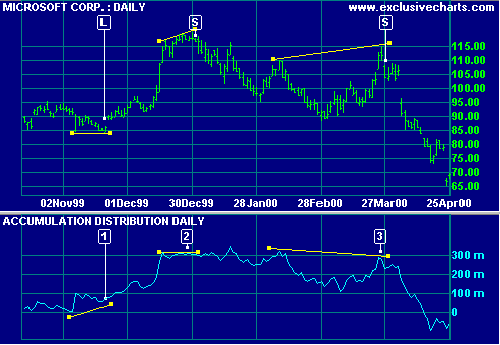
- Go long [L]. The bullish divergence correctly predicted the subsequent
rally.
- Go short [S]. The bearish divergence signaled the correction in
January.
- Go short [S]. The bearish divergence signaled the correction in April.
Related Topics
Price & Volume Trend
Accumulation & Distribution