Volume
Volume is used to highlight unusual trading activity in a security. It can be
displayed as a separate indicator in Daily, Weekly or Monthly format.
Volume signals are covered in detail under
Volume
Patterns.
Example
Coca Cola Corporation shows a close-up of a ranging market with
 daily volume and a
 20 day
exponential moving average.
20 day
exponential moving average.
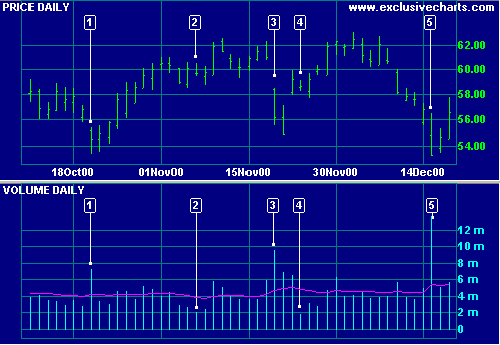
Large increases in volume can be seen on days [1],[3] and [5] - when closing
price falls sharply, signaling that
distribution is taking place.
There is unusually low volume on days [2] and [4], both are
inside days signaling uncertainty.
Setup
See
Indicator Panel for directions on how to set up an indicator. To alter the
default settings -
Edit Indicator Settings.
To create a Volume Moving Average:
- Open the
 Indicator Panel
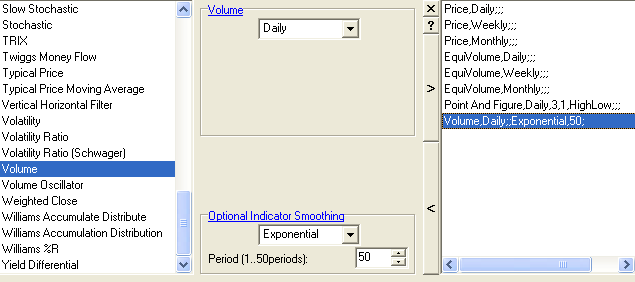
- Select Volume in the left column
- Under Optional Indicator Smoothing, set a moving average
(the above example has been set to a 50-Day exponential moving average of
Volume)
- Save [>] the indicator settings and
- Close [x] the Indicator Panel.
Related Topics
Chart
Basics
The key to analysing bar charts: control, commitment, OHLC, whipsaws, long and
short positions...
Volume Patterns
Volume activity provides powerful confirmation of price signals and often
gives advance warning of...
Volume Indicators
Volume indicators confirm the strength of trends and warn of reversals. They
include sophisticated indicators that compare...
Equivolume
The greatest advance in the last decade, equivolume exposes price and volume
interaction...
Ease
of movement
Developed by Richard W Arms, this powerful indicator highlights the
relationship between price and volume...
Money Flow Index
Money Flow measures trend strength and warns of likely reversal points...
On
Balance Volume
Developed by Joseph Granville, OBV provides a powerful measure of accumulation
and distribution by comparing volume to price movements...
Indicator Smoothing
Smooth indicator lines with exponential moving averages.
External Links
Advancing, Declining, Unchanged Volume - Technical Analysis from A to Z
Advancing, Declining, Unchanged Volume - Steve Achelis' best-selling book,
Technical Analysis from A to Z
Volume -- Chart School
Learn the How, the What, and the Where of technical analysis and stock
charting.
Technical
Analysis from A to Z
Volume - Steve Achelis' best-selling book, Technical Analysis from A to Z
Price By Volume -- Chart School
Learn the How, the What, and the Where of technical analysis and stock
charting.