Chaikin Oscillator
Marc Chaikin uses the Chaikin Oscillator to monitor the flow of money in and out of the market - comparing money flow to price action helps to identify tops and bottoms in short and intermediate cycles. He suggests that it be used in conjunction with a 21 day price envelope and an overbought/oversold indicator (such as Momentum or RSI).
The Chaikin Oscillator is calculated by subtracting a 10 period exponential moving average from a 3 period exponential moving average of the Accumulation Distribution line.
Trading Signals
The best signals are divergences:
-
Go long on a bullish divergence.
-
Go short on a bearish divergence.
Example
Microsoft Corporation with ![]() Price envelopes (at 10% around a 20 day exponential moving average) and
Price envelopes (at 10% around a 20 day exponential moving average) and ![]() Chaikin oscillator.
Chaikin oscillator.
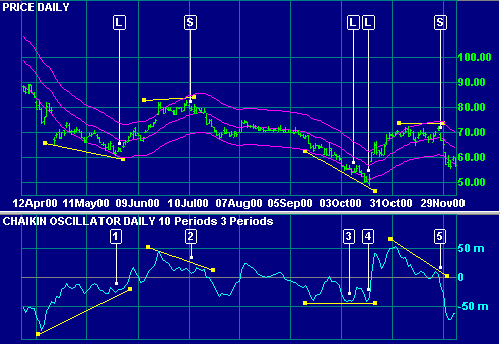
- Go long [L] on bullish divergence.
- Go short [S] on bearish divergence.
- Go long [L] on bullish divergence. This position is stopped out when price falls below the recent low.
- Bullish triple divergence. Re-enter long position [L].
- Go short [S] on bearish divergence.
Related Topics
External Links
Chaikin Oscillator -- Chart School
Chaikin Oscillator - Technical Analysis from A to Z