|
MACD Part 3 Part 1 | Part 2 | Part 3 | Part 4 |
| MACD Benefits |
One of the primary benefits of MACD is that it incorporates aspects of both momentum and trend in one indicator. As a trend-following indicator, it will not be wrong for very long. The use of moving averages ensures that the indicator will eventually follow the movements of the underlying security. By using exponential moving averages, as opposed to simple moving averages, some of the lag has been taken out.
As a momentum indicator, MACD has the ability to foreshadow moves in the underlying security. MACD divergences can be key factors in predicting a trend change. A negative divergence signals that bullish momentum is waning and there could be a potential change in trend from bullish to bearish. This can serve as an alert for traders to take some profits in long positions, or for aggressive traders to consider initiating a short position.
MACD can be applied to daily, weekly or monthly charts. MACD represents the convergence and divergence of two moving averages. The standard setting for MACD is the difference between the 12 and 26-period EMA. However, any combination of moving averages can be used. The set of moving averages used in MACD can be tailored for each individual security. For weekly charts, a faster set of moving averages may be appropriate. For volatile stocks, slower moving averages may be needed to help smooth the data. No matter what the characteristics of the underlying security, each individual can set MACD to suit his or her own trading style, objectives and risk tolerance.
| MACD Drawbacks |
One of the beneficial aspects of MACD may also be a drawback. Moving averages, be they simple, exponential or weighted, are lagging indicators. Even though MACD represents the difference between two moving averages, there can still be some lag in the indicator itself. This is more likely to be the case with weekly charts than daily charts. One solution to this problem is the use of the MACD-Histogram.
MACD is not particularly good for identifying overbought and oversold levels. Even though it is possible to identify levels that historically represent overbought and oversold levels, MACD does not have any upper or lower limits to bind its movement. MACD can continue to overextend beyond historical extremes.
MACD calculates the absolute difference between two moving averages and not the percentage difference. MACD is calculated by subtracting one moving average from the other. As a security increases in price, the difference (both positive and negative) between the two moving averages is destined to grow. This makes its difficult to compare MACD levels over a long period of time, especially for stocks that have grown exponentially.
Amazon
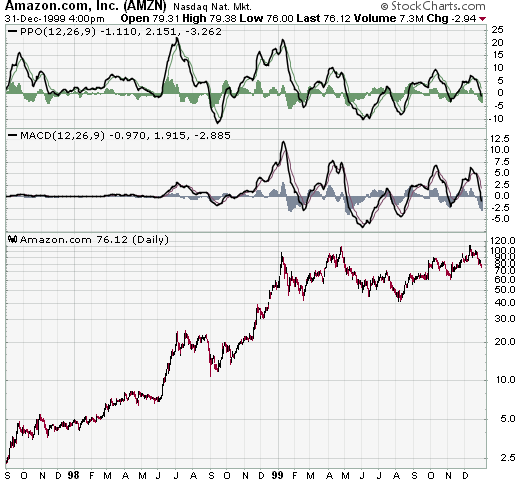
The AMZN chart demonstrates the difficult in comparing MACD levels over a long period of time. Before 1999, AMZN's MACD is barely recognizable and appears to trade close to the zero line. MACD was indeed quite volatile at the time, but this volatility has been dwarfed since the stock rose from below 20 to almost 100.
An alternative is to use the Price Oscillator, which find the percentage difference between two moving averages:
(12 day EMA - 26 day EMA) / (12 day EMA)
(20 - 18) / 20 = .10 or +10%
The resulting percentage difference can be compared over a longer period of time. On the AMZN chart, we can see that the Price Oscillator provides a better means for a long-term comparison. For the short term, MACD and the Price Oscillator are basically the same. The shape of the lines, the divergences, moving average crossovers and centerline crossovers for MACD and the Price Oscillator are virtually identical.
| MACD Conclusion |
Since Gerald Appel developed MACD, there have been hundreds of new indicators introduced to technical analysis. While many indicators have come and gone, MACD is an oscillator that has stood the test of time. The concept behind its use is straightforward and its construction simple, yet it remains one of the most reliable indicators around. The effectiveness of MACD will vary for different securities and markets. The lengths of the moving averages can be adapted for a better fit to a particular security or market. As with all indicators , MACD is not infallible and should be used in conjunction with other technical analysis tools.
In Part 4, we examine the benefits and drawbacks of MACD-Histogram.