|
MACD Part 1 Part 1 | Part 2 | Part 3 | Part 4 |
| Introduction |
Developed by Gerald Appel, Moving Average Convergence Divergence (MACD) is one of the simplest and most reliable indicators available. MACD uses moving averages, which are lagging indicators, to include some trend-following characteristics. These lagging indicators are turned into a momentum oscillator by subtracting the longer moving average from the shorter moving average. The resulting plot forms a line that oscillates above and below zero, without any upper or lower limits. MACD is a centered oscillator and the guidelines for using centered oscillators apply.
| MACD Formula |
The most popular formula for the "standard" MACD is the difference between a security's 26-day and 12-day exponential moving averages. This is the formula that is used in many popular technical analysis programs, including SharpCharts, and quoted in most technical analysis books on the subject. Appel and others have since tinkered with these original settings to come up with a MACD that is better suited for faster or slower securities. Using shorter moving averages will produce a quicker, more responsive indicator, while using longer moving averages will produce a slower indicator, less prone to whipsaws. For our purposes in this article, the traditional 12/26 MACD will be used for explanations. Later in the indicator series, we will address the use of different moving averages in calculating MACD.
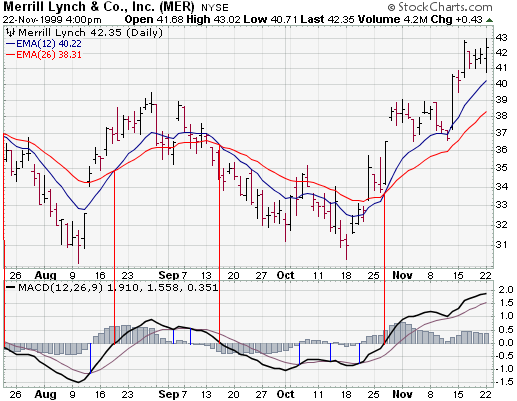
Of the two moving averages that make up MACD, the 12-day EMA is the faster and the 26-day EMA is the slower. Closing prices are used to form the moving averages. Usually, a 9-day EMA of MACD is plotted along side to act as a trigger line. A bullish crossover occurs when MACD moves above its 9-day EMA and a bearish crossover occurs when MACD moves below its 9-day EMA. The Merrill Lynch chart below shows the 12-day EMA (thin blue line) with the 26-day EMA (thin red line) overlaid the price plot. MACD appears in the box below as the thick black line and its 9-day EMA is the thin blue line. The histogram represents the difference between MACD and its 9-day EMA. The histogram is positive when MACD is above its 9-day EMA and negative when MACD is below its 9-day EMA.
Merrill Lynch
| What does MACD do? |
MACD measures the difference between two moving averages. A positive MACD indicates that the 12-day EMA is trading above the 26-day EMA. A negative MACD indicates that the 12-day EMA is trading below the 26-day EMA. If MACD is positive and rising, then the gap between the 12-day EMA and the 26-day EMA is widening. This indicates that the rate-of-change of the faster moving average is higher than the rate-of-change for the slower moving average. Positive momentum is increasing and this would be considered bullish. If MACD is negative and declining further, then the negative gap between the faster moving average (green) and the slower moving average (blue) is expanding. Downward momentum is accelerating and this would be considered bearish. MACD centerline crossovers occur when the faster moving average crosses the slower moving average.
Merrill Lynch
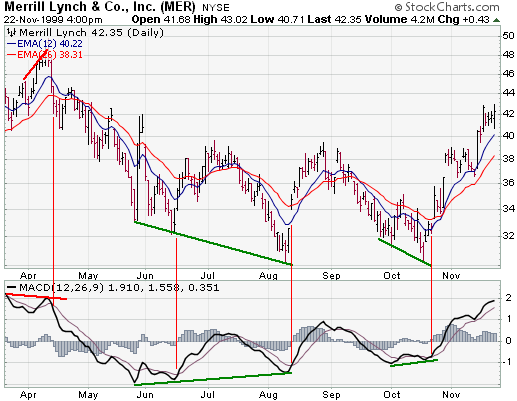
This Merrill Lynch chart shows MACD as a solid black line and its 9-day EMA as the thin blue line. Even though moving averages are lagging indicators, notice that MACD moves faster than the moving averages. In this example with Merrill Lynch, MACD also provided a few good trading signals as well.
| MACD Bullish Signals |
MACD generates bullish signals from three main sources:
Positive Divergence
Novellus
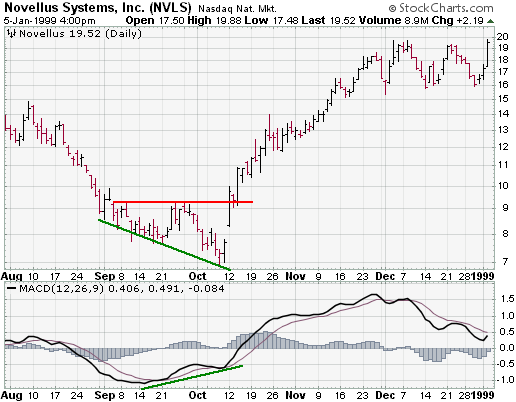
A positive divergence occurs when MACD begins to advance and the security is
still in a downtrend and makes a lower reaction low. MACD can either form as a
series of higher lows or a second low that is higher than the previous low.
Positive divergences are probably the least common of the three signals, but are
usually the most reliable and lead to the biggest moves.
Bullish Moving Average Crossover
Novellus
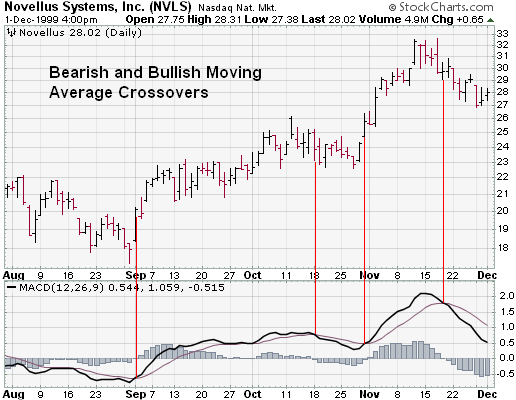
A bullish moving average crossover occurs when MACD moves above its 9-day EMA or
trigger line. Bullish moving average crossovers are probably the most common
signals and as such are the least reliable. If not used in conjunction with
other technical analysis tools, these crossovers can lead to
whipsaws
and many false signals. Moving average crossovers are sometimes used to confirm
a positive divergence. The second low or higher low of a positive divergence can
be considered valid when it is followed by a bullish moving average crossover.
Sometimes it is prudent to apply a price filter to the moving average crossover in order to ensure that it will hold. An example of a price filter would be to buy if MACD breaks above the 9-day EMA and remains above for three days. The buy signal would then commence at the end of the third day.
Bullish Centerline Crossover
Apple
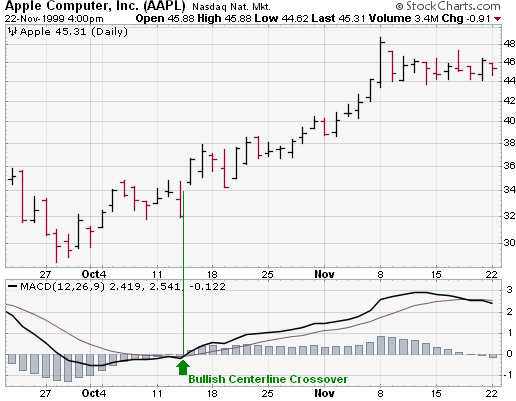
A bullish centerline crossover occurs when MACD moves above the zero line and
into positive territory. This is a clear indication that momentum has changed
from negative to positive, or from bearish to bullish. After a positive
divergence and bullish moving average crossover, the centerline crossover can
act as a confirmation signal. Of the three signals, moving average crossover are
probably the second most common signals.
Using a Combination of Signals
Halliburton
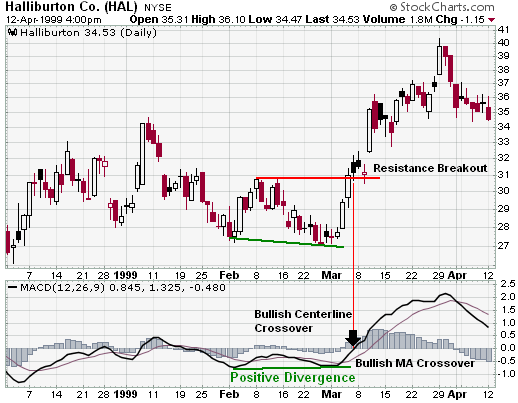
Even though some traders may use only one of the above signals to form a buy or
a sell signal, using a combination can generate more robust signals. In the
Halliburton example, all three bullish signals were present and the stock still
advanced another 20%. The stock formed a lower low at the end of February, but
MACD formed a higher low, thus creating a potential positive divergence. MACD
then formed a bullish crossover by moving above its 9-day EMA. And finally, MACD
traded above zero to form a bullish centerline crossover. At the time of the
bullish centerline crossover, the stock was trading at 32 1/4 and went above 40
immediately after that. In August, the stock traded above 50.
In Part 2, we look at MACD bearish signals.