|
MACD Part 2 Part 1 | Part 2 | Part 3 | Part 4 |
| Bearish Signals |
MACD generates bearish signals from three main sources. These signals are mirror reflections of the bullish signals.
Negative Divergence
A negative
divergence forms when the security advances or moves sideways and MACD
declines. The negative divergence in MACD can take the form of either a lower
high or a straight decline. Negative divergences are probably the least common
of the three signals, but are usually the most reliable and can warn of an
impending peak.
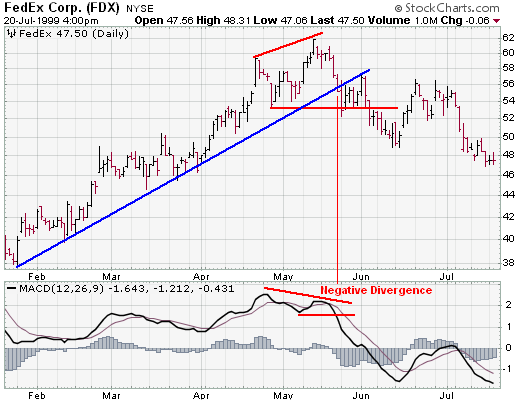
Federal Express
The FDX chart shows a negative divergence when MACD formed a lower high in May and the stock formed a higher high at the same time. This was a rather blatant negative divergence and signaled that momentum was slowing. A few days later, the stock broke the uptrend line and MACD formed a lower low.
There are two possible means of confirming a negative divergence. First, the indicator can form a lower low. This is traditional peak-and-trough analysis applied to an indicator. With the lower high and subsequent lower low, the up trend for MACD has changed from bullish to bearish. Second, a bearish moving average crossover, which is explained below, can act to confirm a negative divergence. As long as MACD is trading above its 9-day EMA or trigger line, it has not turned down and the lower high is difficult to confirm. When MACD breaks below its 9-day EMA, it signals that the short-term trend for the indicator is weakening, and a possible interim peak has formed.
Bearish moving average crossover
The most common signal for MACD is the moving average crossover. A bearish
moving average crossover occurs when MACD declines below its 9-day EMA. Not only
are these signals the most common, but they also produce the most false signals.
As such, moving average crossovers should be confirmed with other signals to
avoid
whipsaws and false readings.
Merck
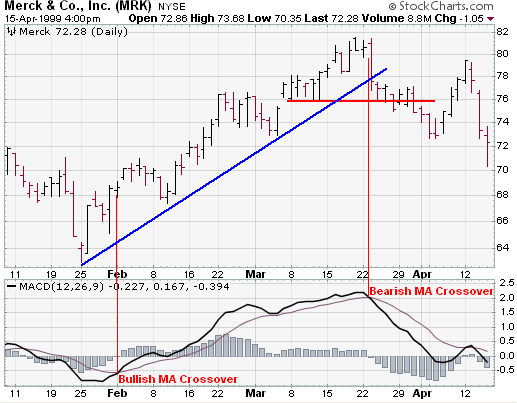
Sometimes a stock can be in a strong uptrend and MACD will remain above its trigger line for a sustained period of time. In this case, it is unlikely that a negative divergence will develop. A different signal is needed to identify a potential change in momentum. This was the case with MRK in February and March. The stock advanced in a strong up trend and MACD remained above its 9-day EMA for 7 weeks. When a bearish moving average crossover occurred, it signaled that upside momentum was slowing. This slowing momentum should have served as an alert to monitor the technical situation for further clues of weakness. Weakness was soon confirmed when the stock broke its uptrend line and MACD continued its decline and moved below zero.
Bearish centerline crossover
A bearish centerline crossover occurs when MACD moves below zero and into
negative territory. This is a clear indication that momentum has changed from
positive to negative, or from bullish to bearish. The centerline crossover can
act as an independent signal, or confirm a prior signal such as a moving average
crossover or negative divergence. Once MACD crosses into negative territory,
momentum, at least for the short term, has turned bearish.
Unisys
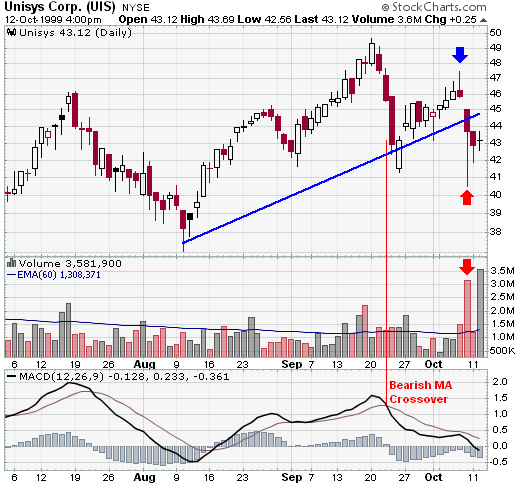
The significance of the centerline crossover will depend on the previous movements of MACD as well. If MACD is positive for many weeks, begins to trend down and then crosses into negative territory, it would be considered bearish. However, if MACD has been negative for a few months, breaks above zero and then back below, it may be seen as more of a correction. In order to judge the significance of a centerline crossover, traditional technical analysis can be applied to see if there has been a change in trend, higher high or lower low.
The UIS chart depicts a bearish centerline crossover that preceded a 25% drop in the stock that occurs just off the right edge of the chart. Although there was little time to act once this signal appeared, there were other warnings signs just prior to the dramatic drop.
In addition to the signal mentioned above, the bearish centerline crossover occurred after MACD had been above zero for almost two months. Since 20-Sept, MACD had been weakening and momentum was slowing. The break below zero acted as the final straw of a long weakening process.
| Combining Signals |
As with bullish MACD signals, bearish signals can be combined to create more robust signals. In most cases, stocks fall faster than they rise. This was definitely the case with UIS and only two bearish MACD signals were present. Using momentum indicators like MACD, technical analysis can sometimes provide clues to impending weakness. While it may be impossible to predict the length and duration of the decline, being able to spot weakness can enable traders to take a more defensive position.
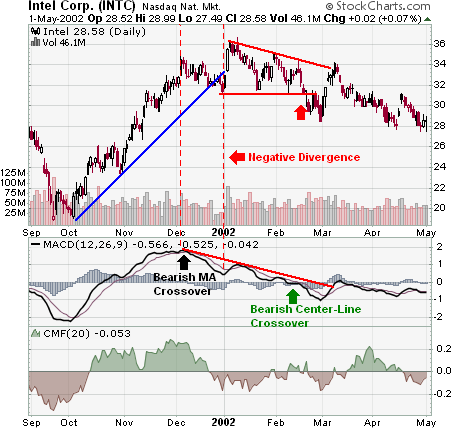
In 2002, Intel dropped from above 36 to below 28 in a few months. Yet it would seem that smart money began distributing the stock before the actual decline. Looking at the technical picture, we can spot evidence of this distribution and a serious loss of momentum.
For those waiting for a recovery in the stock, the continued decline of momentum suggested that selling pressure was increasing, and not about to decrease. Hindsight is 20/20, but with careful study of past situations, we can learn how to better read the present and prepare for the future.
In Part 3, we look at some of the benefits and drawbacks of MACD.