Bollinger Bands were invented by John Bollinger. Used to confirm trading signals, normally from a Momentum Indicator, the bands indicate overbought and oversold levels relative to a moving average.
Bollinger Bands are calculated at a specified number of standard deviations above and below the moving average, causing them to widen when prices are volatile and contract when prices are stable.
Bollinger originally used a 20 day simple moving average and set the bands at 2 standard deviations, suited to intermediate cycles.
Microsoft is charted with
![]() 20 day
Bollinger bands at 2 standard deviations.
20 day
Bollinger bands at 2 standard deviations.
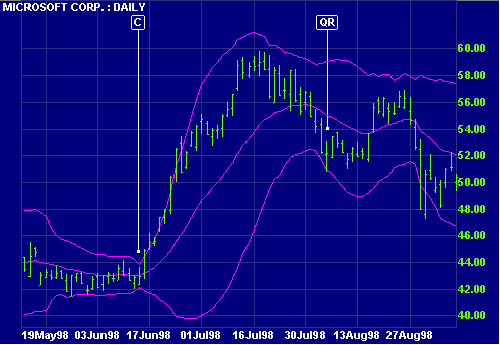
Contracting bands warn that the market is about to trend: the bands first converge into a narrow neck, followed by a sharp price movement. The first breakout is often a false move, preceding a strong trend in the opposite direction. A contracting range [C] is evident in June 1998: the bands converge to a width of $2, followed by a breakout in July to a new high.
A move that starts at one band normally carries through to the other, in a ranging market.
A move outside the band indicates that the trend is strong and likely to continue - unless price quickly reverses. Note the quick reversal [QR] in early August.
A trend that hugs one band signals that the trend is strong and likely to continue. Wait for divergence on a Momentum Indicator to signal the end of a trend.
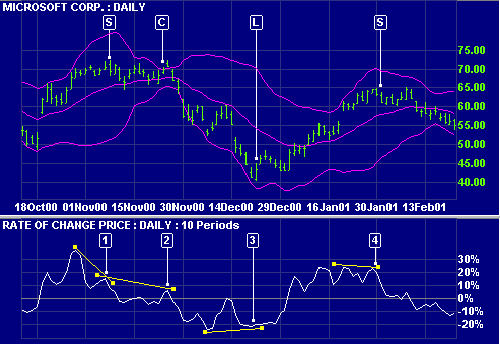
Microsoft Corporation:
![]() 20 day
Bollinger bands at 2 standard deviations and
20 day
Bollinger bands at 2 standard deviations and
![]() 10 day Rate
of Change.
10 day Rate
of Change.
www.BollingerBands.com: Bollinger Bands Tutorial
www.BollingerBands.com: Bollinger Bands Tutorial
Bollinger
Bands - Technical Analysis from A to Z
Bollinger Bands -- Chart School
Invest FAQ:Technical Analysis:Bollinger Bands
Another Look at Bollinger Bands