Momentum
Momentum measures the rate of change in closing prices and is used to detect
trend weakness and likely reversal points. It is often underrated because of its
simplicity.
High Momentum readings (positive or negative) occur when a trend is at its
strongest. Lower readings are found at the start and end of trends.
Overbought and oversold levels are set separately for each security, based on
the performance of the indicator over past cycles.
Trading Signals
Different Momentum signals are used for ranging markets and trending markets.
Ranging Markets
First, you will need to set overbought and oversold levels based on your
observation of past ranging markets. The levels should cut across at least
two-thirds of the peaks and troughs.
Go long when:
- Momentum crosses to below the oversold level and then rises back above it;
or
- On bullish divergences - where the first trough is below the oversold
level.
Go short when:
- Momentum crosses to above the overbought level and then falls back below
it.
- On a bearish divergence - with the first peak above the overbought level.
Trending Markets
First, identify the trend direction using Momentum or a
trend
indicator. Momentum tends to stay above zero during an up-trend and below
zero during a down-trend.
Only take signals in the direction of the trend.
-
Up-trend: go long if Momentum turns upwards when below zero.
-
Down-trend: go short if Momentum turns downward when above zero.
Exit using a trend indicator.
Trend lines are also drawn on the Momentum indicator. A break in the trend
line often occurs in advance of a similar break on the price chart.
Take profits on
divergences and trend line breaks.
Example
Dow Jones Industrial Average with
 10-day Momentum
indicator and
10-day Momentum
indicator and  Bollinger bands at 2.5 standard deviations around a 21-day
exponential moving average.
Bollinger bands at 2.5 standard deviations around a 21-day
exponential moving average.
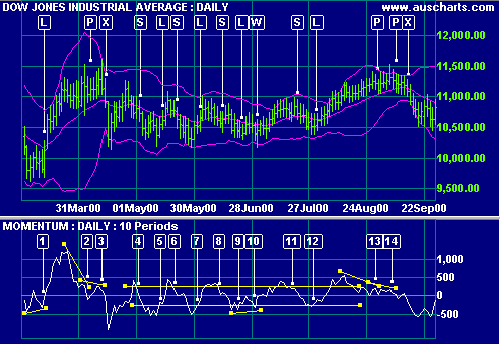
- Go long [L] when the MA turns upwards after a bullish Momentum
divergence.
- Take profits [P] on a bearish divergence.
- Exit [X] when price closes below the MA.
- Price has started ranging, shown by the fluctuation of price around the MA
and Momentum around the zero line. Set overbought and oversold levels based on
observation of previous ranging markets. Go short [S] when Momentum turns back
below the overbought line.
- Go long [L] when Momentum crosses back above the oversold line.
- Go short [S] again when Momentum crosses back below the overbought line.
- Go long [L].
- Go short [S].
- Go long [L] when Momentum crosses back above the oversold line. The long
position is stopped out by a lower Low at [W].
- Go long again at [W] - the signal is supported by a bullish divergence.
- Go short [S].
- Go long [L]. Price then breaks out of the ranging market and stays above
the MA. Switch to trending signals.
- Take profits [P] on a bearish divergence.
- Take further profits [P] on a bearish triple divergence. Exit [X] the
trade when price closes below the MA.
Setup
The default indicator window is 12 days. To alter the default settings - see
Edit Indicator Settings.
See
Indicator Panel for directions on how to set up an indicator.
Related Topics
Closing Price / Previous Close
How to identify trends, control, commitment, uncertainty, inside and outside
days...
Rate Of Change (Price)
A refinement of Momentum - Rate of Change is designed to fluctuate as a
percentage around the zero line...
Momentum Construction
First, select the indicator period. Then, calculate Closing Price [today] -
Closing Price [n days ago]...
External Links
Technical Charting Archives : January 14, 2000
Momentum - Part 1 What it is and what it can do for you.
Technical Charting Archives : January 21, 2000
Momentum - Part 2 Overbought and oversold, divergences
Technical Charting Archives : January 28, 2000
Momentum - Part 3 Momentum Patterns and using moving averages on momentum
indicators
Technical Charting Archives : December 10,1999
Momentum and the Momentum Indicator. Measure Twice-Cut Once
Momentum & Rate of Change
Momentum -- Chart School
Learn the How, the What, and the Where of technical analysis and stock
charting.
Momentum -
Technical Analysis from A to Z
Momentum - Steve Achelis' best-selling book, Technical Analysis from A to Z