Important Bull Market Results
Overall performance rank for up/down breakouts (1 is best): 23 out of
23; 13 out of 21
Break even failure rate for up/down breakouts: 19%; 14%
Average rise/decline: 28%; 15%
Throwback/pullback rate: 52%; 51%
Percentage meeting price target for up/down breakouts: 63%; 44%
Identification Guidelines
|
Characteristic |
Discussion |
|
Price trend |
Can be up or down leading
to the pattern |
|
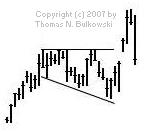
Shape |
A megaphone tilted down with
the top horizontal. |
|
Trendlines |
The top trendline is horizontal,
the bottom one slopes downward. |
|
Touches |
At least two peaks and two
valleys should touch their respective trendline. |
|
Volume shape |
Trends upward 54% to 59% of the time
with a dome shape. |
|
Breakout |
Upward 51% of the time. |
Trading Tips
|
Trading Tactic |
Explanation |
|
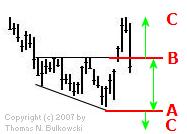
Measure rule |
Compute the height from the horizontal trendline
(B in the Measure Rule figure to the right) to the
lowest valley (A) and multiply it by the above “
percentage meeting price target.”
Add the result to the horizontal trendline (B, upward
breakouts) or subtract it from the lowest valley (A,
downward breakouts) to get the price target (C).
|
|
Intraformation trade |
Buy at the bottom trendline
when price starts rising and sell or sell short once price turns at the horizontal trendline. |
|
Buy at 3rd touch |
When price touches the bottom
trendline for the third time and begins rising, buy. |
|
Partial rise |
A partial rise works 54% of
the time. |
|
Partial decline |
A partial decline works 63%
of the time. |
|
Price trend |
The best performing patterns are those with an
intermediate- or long-term (over three months) price trend leading to the pattern.
|
|
Yearly middle |
For both breakout directions, the
middle third of the yearly price range performs best. For downward breakouts, the highest third also performs well. |
|
Volume trend |
A rising volume trend results in
the best postbreakout performance. |
|
Throwbacks and Pullbacks |
Throwbacks and pullbacks hurt postbreakout
performance. |
|