Important Bull Market Results
Overall performance rank for up/down breakouts (1 is best): 19 out of
23; 18 out of 21
Break even failure rate for up/down breakouts: 15%; 18%
Average rise/decline: 29%; 15%
Throwback/pullback rate: 54%; 48%
Percentage meeting price target for up/down breakouts: 62%; 37%
Identification Guidelines
|
Characteristic |
Discussion |
|
Price trend |
Upward leading to the pattern. |
|
Shape |
Higher peaks and lower valleys
– a megaphone shape. |
|
Trendlines |
The top trendline slopes
upward, the bottom one slopes downward. |
|
Touches |
At least two peaks and two
valleys should touch their respective trendlines. |
|
Volume shape |
Upward, often U-shaped. The link on the left shows an
example. |
|
Breakout |
Can occur in any direction (upward 50%, downward 50%)
and it happens when price pierces a trendline or moves beyond the end of the pattern. |
Trading Tips
|
Trading Tactic |
Explanation |
|
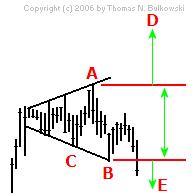
Measure rule |
Compute the difference between the highest peak
(A) and lowest valley (B)
in the pattern to get the height. Multiply the height by the "percentage
meeting price target"
(see above) and add it to the highest peak (A, upward
breakout) or subtract it from the lowest valley (B,
downward breakout) to get a price target, D or
E, respectively. |
|
Intraformation trade |
Buy when price rebounds off the lower trendline
(C), and short at the top
(A) when price heads down. |
|
Buy at 3rd touch |
When price touches the bottom
trendline for the third time (C) and begins rising,
buy. |
|
Short at the top |
When price touches the top
trendline and begins falling (A), sell or sell short.
|
|
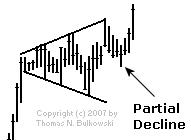
Partial rise |
A partial rise works 61% of
the time. |
|
Partial decline |
A partial decline works 72%
of the time |
|
Price trend |
The best performing patterns
are those with an intermediate-term (three to six months) rise leading to the pattern, regardless of the breakout direction.
|
|
Yearly low |
Those with breakouts near the yearly low perform best,
regardless of the breakout direction. The link to the left discusses performance,
and the following link
provides additional information. |
|
Volume trend |
Downward for the best performance, regardless of the
breakout direction. |
|
Breakout |
The breakout direction is upward
50% of the time. |
|
Throwbacks and pullbacks |
Throwbacks hurt postbreakout performance
when they appear, but pullbacks show no influence. |
|