|
|
|
The broadening bottom is one of those chart patterns that appears often,
but you might want to avoid trading. The performance rank approaches the bottom of the list
with a comparatively high break even failure rank and low average rise in a bull market. Its
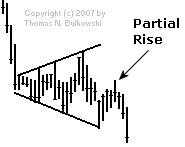
only redeeming value is the partial decline
which does an excellent job of predicting an upward
breakout. For more information see pages 11 to 27 of the book
Encyclopedia of Chart Patterns, Second Edition, and the
following...
|
|
|
|
|
|
Score your chart pattern for
performance by clicking
here |
|
Important Bull Market Results
Overall performance rank for up/down breakouts (1 is best): 17 out of
23; 17 out of 21
Break even failure rate for up/down breakouts: 10%; 16%
Average rise/decline: 27%; 15%
Throwback/pullback rate: 41%; 42%
Percentage meeting price target for up/down breakouts: 59%; 44%
Identification Guidelines
|
Characteristic |
Discussion |
|
Price trend |
Downward 85% of the time leading to the pattern. |
|
Shape |
Higher peaks and lower valleys
– a megaphone shape. |
|
Trend lines |
The top trend line slopes
upward, the bottom one slopes downward. |
|
Touches |
At least two peaks and two
valleys should touch the associated trend line. |
|
Volume |
Upward 57% to 58% of the time. |
|
Breakout |
Can occur in any direction
(upward 53% of the time) and it happens when price pierces a trendline or moves beyond the end of the pattern. |
Trading Tips
|
Trading Tactics |
Explanation |
|
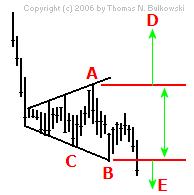
Measure rule |
Compute the difference between the highest peak
(A) and lowest valley (B)
in the pattern to get the height. Multiply the height by the "percentage
meeting price target"
(see above) and add it to the highest peak (A, upward
breakout) or subtract it from the lowest valley (B,
downward breakout) to get a price target, D or
E, respectively. |
|
Intraformation trade |
Buy when price rebounds off the lower trendline
(C), and short at the top
(A) when price heads down. |
|
Buy at 3rd touch |
When price touches the bottom
trendline for the third time (C) and begins rising,
buy. |
|
Short at the top |
When price touches the top
trendline and begins falling (A), sell or sell short.
|
|
Partial rise |
A partial rise works 67% of
the time. |
|
Partial decline |
A partial decline works 80%
of the time |
|
Price trend |
The best performing patterns
with upward breakouts are those with a short-term (less than three months) decline leading to the pattern. |
|
Yearly high |
Upward breakouts perform best when
the breakout is within a third of the yearly high. Downward breakouts excel within a third of the yearly low. |
|
Volume trend |
Upward breakouts: do best when volume
trends downward; downward breakouts do best when volume trends upward. |
|
Breakout |
The breakout direction is upward
53% of the time. |
|
Throwbacks and pullbacks |
Both hurt performance when they
appear. The links on the left define terms and these links discuss performance for throwback and pullbacks. |
|
|
|
|
|
|
 The Measure Rule
|
|
Example
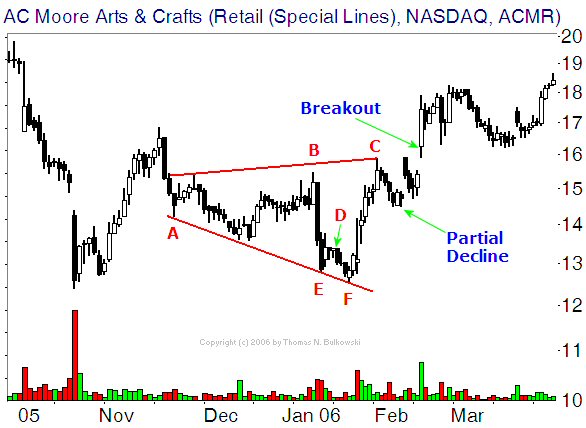
The above figure shows an example of a broadening bottom chart pattern. Price begins the broadening bottom at
A and forms diverging peaks and valleys. At the end of the broadening bottom,
C, a partial decline occurs which correctly predicts an upward breakout. This allowed
astute traders early entry.
Notice that if you draw the top trendline to connect point B, the pattern would take
on the appearance of a right-angled and descending broadening formation because the top trendline would be flat or
nearly so. Also, price at E bounces to D and then makes a lower low at F. Point D looks like a partial rise which fails
when the predicted breakout at F does not occur. This is one example of why trading
broadening bottoms, even if relying on a partial decline or partial rise, is difficult.
|
|