Volume Accumulation Oscillator
(Chaikin Oscillator)
Volume analysis is important for identifying internal strengths and
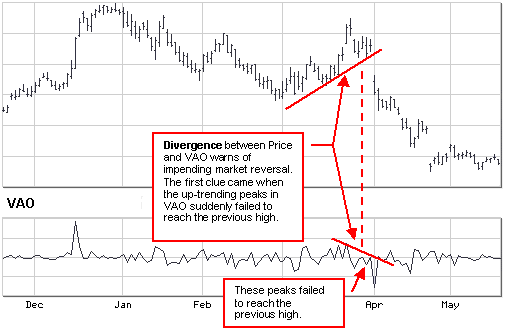
weaknesses in a market. Very often, a divergence between volume and price
movements can offer clues to an impending reversal.
Overview
The Volume Accumulation Oscillator (VAO) -- also called the
Chaikin Oscillator after its designer Marc Chaikin -- is more sensitive to
volume versus price than the On Balance Volume indicator.
VAO assigns a proportional amount of volume to the price
according to the relationship between the closing price and the average price
for the day.
- A close above the mean price is given a positive value and a close below
the mean a negative value.
- When the market closes at either the high or low of the day, the volume
is given full value.

In general, volume oscillators are designed based on the
following premises:
- Volume and price normally rise and fall together, and when this
relationship changes it can provide an early indication of a coming change
in trend.
- The more a market is controlled by buyers (accumulation), the
closer it will close to its high. If a market is controlled by sellers
(distribution), it will close below its midpoint for the day.
- Lagging volume on an upward move is often a forewarning of a
weakening market. A declining market is more complex; usually there's a
pickup in volume followed by reduced volume and a period of accumulation
before a valid bottom develops.
Interpretation
Divergence between volume and price movement is often the
sign that a reversal is about to take place. In the short and intermediate term,
the VAO helps to identify market tops and bottoms by sensitively
comparing volume to price action.
Most indicators are most effective when used in conjunction with
other, complimentary indicators. An effective short and intermediate-term
combination of indicators, for example, might include VAO, along with a 21-day
moving average and an overbought/oversold oscillator (e.g., Momentum, ROC, CCI).
The VAO is most valuable when:
- in an overbought/sold position, prices reach a new high or low and the
oscillator fails to exceed its previous high/low reading and then reverses
direction.

Signals
Buy or sell signals are considered reliable only when they
are in keeping with the overall (long-term) trend.
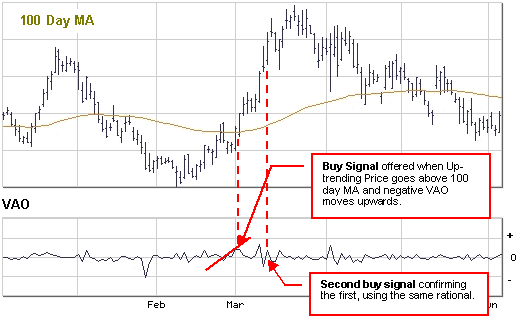
- A buy signal would be generated if an up-trending market is above
its intermediate (100-day) moving average, and a negative VAO turns upwards
(from a trough).
- A sell signal would generated if a stock is below its 100-day
moving average and a positive VAO turns downwards (from a peak).
Further Details
The default VAO is created by subtracting a 10-period
exponential moving average of the Accumulation-Distribution Line from a 3-period
moving average of the Accumulation-Distribution Line.
Further Information
Also see the On-Balance Volume and
Accumulation/Distribution
indicators.


