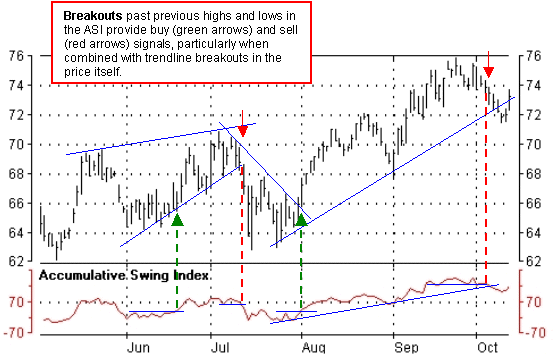
ASI was developed by Welles Wilder, Jr. as a simple swing system (even though the calculation itself is relatively complex), with signals generated by breakouts past previous highs or lows in the index. Trendlines drawn on the ASI chart are also used to confirm or deny trendline breakouts on a price chart. Any divergence between the Index and price should also be noted.
In his book New Concepts in Technical Trading Systems, Wilder summarizes the usefulness of ASI as follows:
"When the Index is plotted on the same chart as the daily bar chart, trend lines drawn on the ASI can be compared to trend lines drawn on the bar chart. For those who know how to draw meaningful trend lines, the ASI can be a good tool to confirm trend-line breakouts. Often erroneous breaking of trend lines drawn on bar charts will not be confirmed by the trend lines drawn on the ASI. Since the ASI is heavily weighted in favor of the close price, a quick run up or down during a day's trading does not adversely affect the index."
Wilder uses the following terminology in explaining the use of the ASI indicator:
Wilder also designed a system of trailing stop loss points for the Index which he refers to as the Index SAR (Stop and Reverse). For complete details on using this system you should refer to his book New Concepts in Technical Trading Systems.
These rules apply only to the ASI and must be correlated with the price action point.
Buy Signal:
Sell Signal: Downside Breakout -- ASI drops below a previously significant Low Swing Point
See also the Swing Index indicator.