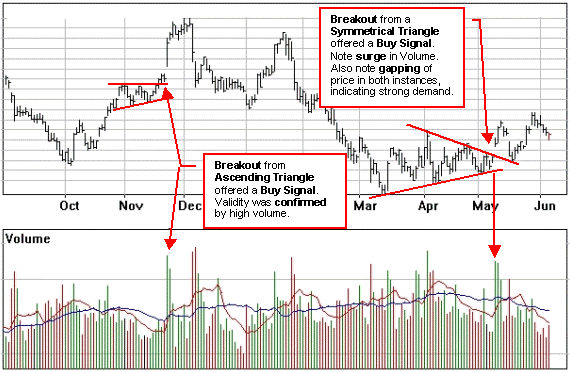
Triangle patterns usually form part way through a strongly trending move and represent a congestive phase in the marketplace. These patterns are important because they are typically followed by sharp increases or declines in price. An established triangle pattern is a valuable signal prior to a relatively predictable price change.
The vertical line measuring the height of the pattern becomes the base of the triangle. The apex is the point of intersection where the two lines meet. There are typically 3 common types of triangles - symmetrical, ascending, and descending:

Symmetrical Triangle
The symmetrical triangle is formed by two converging trendlines encompassing at least two or more rallies and reactions with a breakout following the original trend. It is also called a coil because fluctuation in price and volume decrease until both react sharply, like an unsprung coil.
To complete the pattern, volume should pick up noticeably at the penetration of the trendline
Ascending Triangle (Right Angle)
The symmetrical triangle is a neutral pattern, whereas the ascending right triangle is bullish and the descending right triangle is bearish. The ascending triangle has a rising lower line with a flat or horizontal upper line, indicating that buyers are more aggressive than sellers. This bullish pattern usually results in an upward breakout.
This breakout should have a sharp increase in volume and the upper resistance line should act as support on subsequent dips after the breakout. The minimum price target is equal to the height of the base of the triangle measured upward from the breakout point.
The ascending triangle sometimes also appears as a bottoming pattern. Frequently, an ascending triangle will develop toward the end of a downtrend.. Again, the pattern is considered bullish. When demand remains weaker than supply, a bearish ascending pattern may form and is confirmed with a breakout on the downside on good volume.
Descending Triangle (Right Angle)
The descending triangle is a flipped over ascending triangle with a flat bottom line and a declining upper line. A close under the lower trendline, usually on increased volume, resolves the pattern to the downside as bearish. Volume is less important on the downside than on the upside.
If a rally occurs it usually meets resistance at the lower trendline. The descending triangle can also be found at the top of a market.
Also see Breakout Signals.