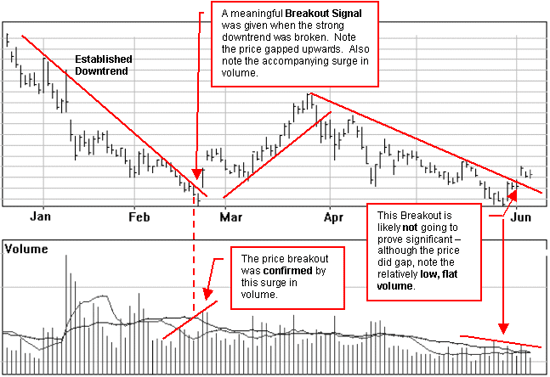

The breaking of an important trendline is often the first sign of an impending change in trend, which is only sometimes a trend reversal. The breaking of a major upward trendline might signal the beginning of a sideways price pattern, which would be identified as a reversal or consolidation type later.
The stronger the trendline broken the more significant. Historically we know that if a strong or "well-tested" trendline is broken and the price moves out of an established range something important has happened to the psychology of the marketplace. We may not know what it is; it will probably be a combination of influences or events. But, whatever the reasons, any pull strong enough to break a long term trendline and carry the price into new ground is usually strong enough to continue pulling the market in the new direction to establish a new trendline.
The odds that a market will continue in the direction of a breakout are high but, of course, there are no guarantees. Remember, this is not a golden rule; it is a pattern which has been repeated many, many times in the past and will be repeated many more times in the future. It gives us something tangible to look for when considering the hundreds and thousands of potential trades we could enter into.
Not every move out of the price pattern constitutes a valid signal of a trend reversal, or resumption if the price is in a narrow trading range. It's helpful to establish valid criteria to minimize the possibility of misinterpreting moves such as whipsaws. A wait for a 3 percent penetration of the boundaries is traditionally necessary before determining that the breakout is valid. The resulting signals are less timely, but a considerable number of misleading moves are removed.
However, many short-term price movements barely exceed 3 percent in total. In short term trades it will be difficult to make a profit if you wait for a 3 percent move to buy, and an additional 3 percent decline for a breakdown to sell. The 3 percent rate works well for longer-term price movements where the fluctuations are much greater. Deciding whether a breakout is valid or not depends on the type of trend being monitored, volume, momentum characteristics and your own experience.
An upward surge in trading activity, or volume, confirms the validity of the breakout. A low volume breakout is suspicious and should be disregarded. Increasing volume is not as essential for a valid signal with downside breakouts, as it is for an upside breakout. Prices will often reverse and put on a small recovery, following the downside breakout. This price increase is regularly accompanied by declining volume.
Also see Trendlines, Dow Theory, Triangles, and Tops & Bottoms.