Price Channel
The Price Channel or Donchian's Four Week Rule is a simple and effective trend following, channel breakout system.
Overview
- Developed as the 4 Week Rule by Richard Donchian, originally for commodity trading
- Can be used on daily, weekly and monthly charts
Louis Lukac's research from 1975 to 1986 compared 23 trading systems. Moving averages and channel breaklouts came out as the top performers and Lukac suggested a channel breakout as the best starting point for technical trading. (Lukac, Louis; The Financial Review, November 1990).

Interpretation
The Price Channel is a simple breakout system. As with all trend following systems, the Price Channel works well in up trends or down trends, but doesn't work well in a sideways channel. The signals derived from the Price Channel are based on the following basic rules:
- When the price is at its highest in a four week period, buy long and cover short positions
- When the price falls below the lows of a four week period, sell short and liquidate long positions
As a trend following system the Price Channel indicator is not meant to catch tops or bottoms. Trend traders may want to extend the period to eight weeks to wait for significant trend signals. Similarly, some traders shorten the time period to a more sensitive 1 or 2 weeks for liquidation purposes.
Signals
The following signals are offered by the Price Channel indicator:
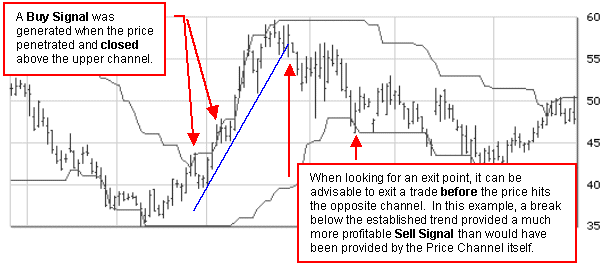
- A buy signal is generated when prices penetrate and close above the upper channel.
- A sell signal is generated when prices penetrate and close below the lower channel.
These signals should, of course, be combined with the use of other indicators to provide confirmation. For example, a relatively simple, yet effective, approach to exiting a trade based on a price channel would be to watch for a break in the long-term trend.
Some Ideas for Applying Shorter Time Periods:
- Can be used to identify trend reversals
- When prices are trending sharply higher, shorten the time span for needed sensitivity
- Use a four week rule for entry and one or two weeks to signal exit points.
- A two week price breakout in the same direction as a moving average crossover signal, makes an exceptional filter on which to base a market decision
- A stop-loss could trail with a one week lag
Further Information
Also see Channels & Envelopes, Keltner Channels, and Bollinger Bands.