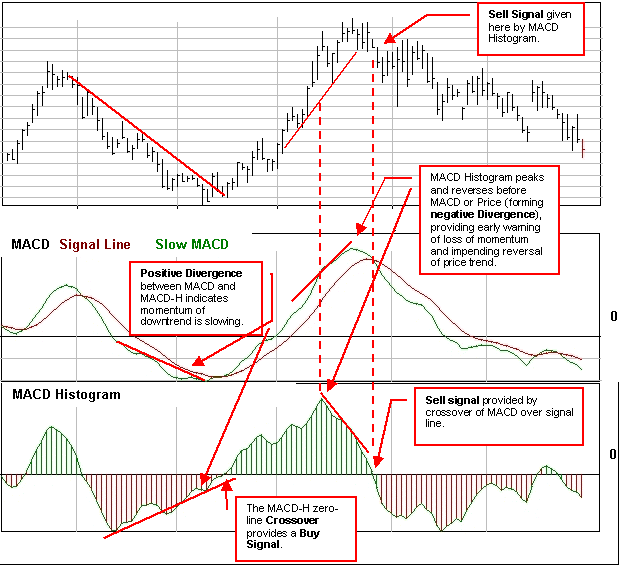
Thomas Aspray found that MACD signals often lagged important market moves, especially when applied to weekly charts. He first experimented with changing the moving averages and found that shorter moving averages did indeed speed up the signals. However, he was looking for a means to anticipate MACD crossovers and came up with the MACD Histogram.

The MACD Histogram represents the difference between MACD and it's signal line (usually the 9-day Exponential Moving Average (EMA) of the MACD). Whenever MACD crosses the signal line, MACD-H crosses the zero line.
Sharp increases in the MACD-H indicate that MACD is rising faster than its 9-day EMA and upward momentum is strengthening. Sharp declines in the MACD-H indicate that MACD is falling faster than its moving average and downward momentum is increasing.
Divergences between MACD and MACD-H are the main tool used to anticipate crossovers. A positive divergence in the MACD-H indicates that MACD is strengthening and could be on the verge of a bullish moving average crossover. A negative divergence in the MACD-H indicates that MACD is weakening and can act to foreshadow a bearish moving average crossover in MACD.
The main signal generated by the MACD-Histogram is a divergence from MACD followed by a zero-line crossover.
In Technical Analysis of the Financial Markets, John Murphy states that the real value of the MACD-H is spotting when the spread between the two lines is widening or narrowing. When the histogram is above its zero line (positive) but starts to fall, the uptrend is weakening. Conversely, when the histogram is below its zero line (negative) and starts to rise, the downtrend is losing momentum. These turns of the histogram provide early warnings that the current trend is losing momentum, and the buy or sell signal is given when the histogram crosses the zero line.
Murphy also advocates a two-tiered approach in order to avoid making trades against the major trend. The weekly MACD-H can be used to generate long-term signals. Then only short-term signals that agree with the major trend are used.
Used this way, the weekly signals become trend filters for daily signals. This prevents using daily signals to trade against the overall trend.
Also see MACD