The MACD method, developed by Gerald Appel, is a trending indicator, telling us whether a stock is in an uptrend or a downtrend. The direction of the long-term trend is the first assessment you should make of any market. If it is trending up, you want to be long (buying). If it is trending down, you want be short (selling). (This wouldn't necessarily hold true for to day traders, of course).
The simplest version of this indicator is composed of two lines: the MACD line, which is the difference between two exponential moving averages (EMAs) and a signal line, which is an EMA of the MACD line itself. The signal or trigger line is plotted on top of the MACD to show buy/sell opportunities. Gerald Appel's MACD method uses a 26-day and 12-day EMA, based on the daily close, and a 9-day EMA for the signal line.
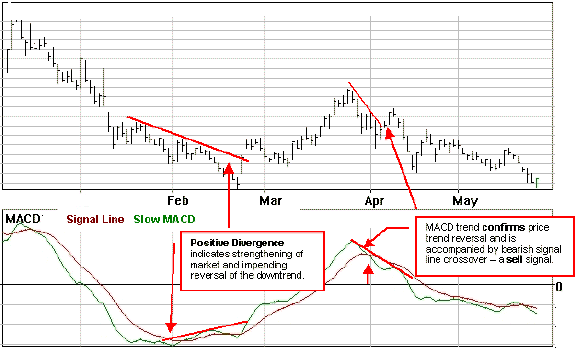
The MACD proves most effective in trending markets rather than choppy, sideways markets. There are two main sets of signals generated by the MACD: crossovers and divergences.
There are two main MACD crossover signals:

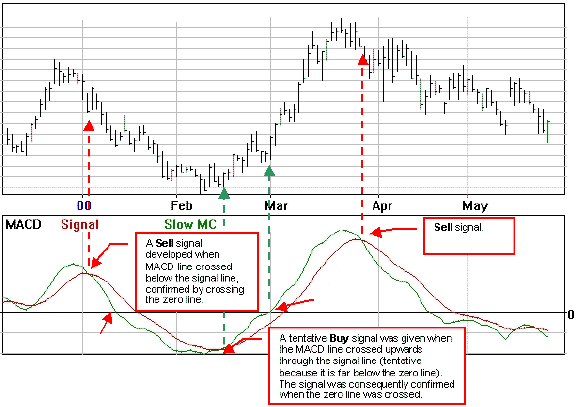
The basic MACD trading rule is to buy when the MACD rises above its signal line. Similarly, a sell signal occurs when the MACD crosses below its signal line. The crossing of the MACD line above the signal line can denote the beginning of a trend. An uptrend typically pauses or stops when the MACD line crosses and falls below the signal line.
The location relative to the zero line is also important in indicating how strong a trend might be. A crossover above the zero line is considered more bullish than one below the zero line. The higher above the zero line it crosses, the stronger the uptrend. If the crossover occurs below the zero line, the uptrend is likely not very strong.
When the bullish crossover occurs above the zero line, the uptrend gains more momentum, and the price rises with more intensity.
Bullish MACD crossovers are probably the most common signals and as such can be less reliable. If not used in conjunction with other technical analysis tools, these crossovers can lead to whipsaws and many false signals.
One way to try and counteract false signals is to apply a price filter to the crossover to see if a trend will hold. An example of a price filter would be to buy if the MACD breaks above the signal line and remains above for three days. The buy signal would then commence at the end of the third day.
The zero line can also be used to produce a signal. It is popular to buy/sell when the MACD crosses above/below the zero line.
A bullish zero line crossover occurs when MACD moves above the zero line and into positive territory. This is a clear indication that momentum has changed from negative to positive, or from bearish to bullish. After a positive divergence and bullish MACD crossover, the zero line crossover can act as a confirmation signal.

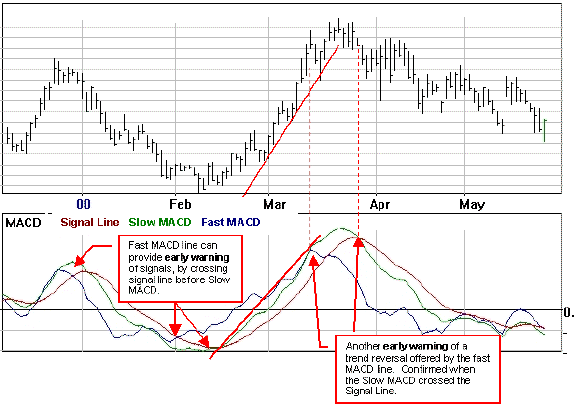
Probably the best way to use the basic MACD is to use a
combination of signals to confirm one another. In addition, a fast MACD line can
be added to enhance the signals generated and to often provide early warning of
changes in trends. An example of a three line MACD is shown below, with the
signal line, the fast MACD line and the slow MACD line. The MACD Histogram is
also commonly used to clarify the relationship between the two MACD lines.

MACD is a trend following indicator, and as such, sacrifices early signals in exchange for keeping you in line with the trend. When a significant trend develops, MACD is often able to capture the majority of the move. When the trend is short lived, however, MACD often proves unreliable.
This is because moving averages themselves are lagging
indicators. Even though MACD represents the difference between two moving
averages, there is still some lag in the indicator itself. This is more likely
to be the case with weekly charts than daily charts. One solution to this
problem is the use of the MACD-Histogram
.
Also see MACD -
Histogram.