The Arms Index has also been called the Short-term Trading Index and TRIN (an acronym for TRading INdex).
TRIN represents the relationship between advancing and declining stocks and the volume in these issues. If there's more volume in advancing stocks, TRIN is less than 1.0; if there's more volume in declining stocks, it's greater than 1.0.
TRIN is usually smoothed with a moving average, 10 days being considered the norm. In some cases two or three averages are shown together, such as the 10-, 20- and 30-day averages.
Trend
Overbought/Oversold Levels
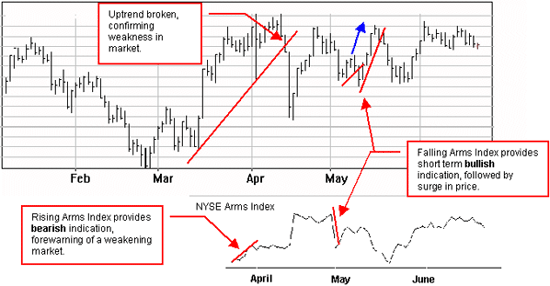
TRIN is often used as an overbought/oversold indicator. When the index drops below 0.8, it can be taken as a potential opportunity to buy. When it rises above 1.2, it can be taken as a potential opportunity to sell. These signals should, of course, be confirmed by referring to other indicators (such as MACD or Parabolic SAR).
Further information
Also see the McClellan Oscillator
In his book New Concepts in Technical Trading Systems, Wilder summarizes the usefulness of ASI as follows:
"When the Index is plotted on the same chart as the daily bar chart, trend lines drawn on the ASI can be compared to trend lines drawn on the bar chart. For those who know how to draw meaningful trend lines, the ASI can be a good tool to confirm trend-line breakouts. Often erroneous breaking of trend lines drawn on bar charts will not be confirmed by the trend lines drawn on the ASI. Since the ASI is heavily weighted in favor of the close price, a quick run up or down during a day's trading does not adversely affect the index."
Wilder uses the following terminology in explaining the use of the ASI indicator:
Wilder also designed a system of trailing stop loss points for the Index which he refers to as the Index SAR (Stop and Reverse). For complete details on using this system you should refer to his book New Concepts in Technical Trading Systems.
These rules apply only to the ASI and must be correlated with the price action point.
Buy Signal:
Sell Signal: Downside Breakout -- ASI drops below a previously significant Low Swing Point
See also the Swing Index indicator.