The McClellan Oscillator is calculated by subtracting a 39-day exponential moving average of the difference between the advancing issues and the declining issues from a 19-day exponential moving average of the difference between the advancing issues and the number of the declining issues in the Exchange.
The McClellan Oscillator is based on the movements of an Exchange, usually the New York Stock Exchange, not on any one particular stock. It is a short to mid-term "market breadth" indicator designed to determine the strength of a market trend. Market breadth is a measure of the percentage of stocks participating in a particular market move; if two-thirds of the stocks listed on an exchange move in the same direction during a trading session analysts say there was significant breadth.
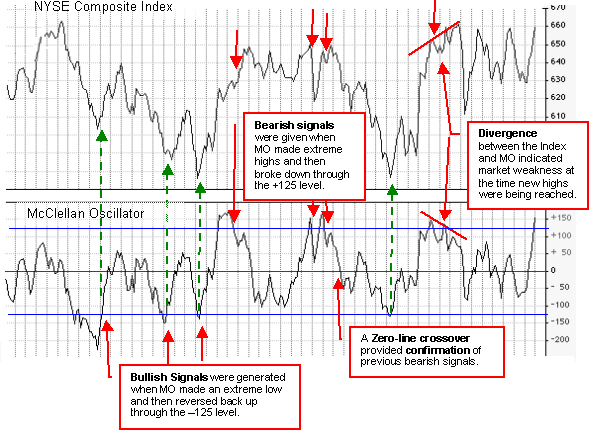
The Oscillator produces three general types of signals:
The McClellan Oscillator offers the following specific signals and alerts:
Divergence
The oscillator leads the index; so if it fails to confirm a new index high or low, the index may be forming a top or bottom. The example chart shows divergence between the index and the oscillator, with the oscillator indicating weakness. The Index subsequently plunged leaving behind a market top. Divergence can provide a warning, and should be combined with the other signals to produce definite entry and exit points.
Oversold/Overbought indications
Zero-line Crossovers
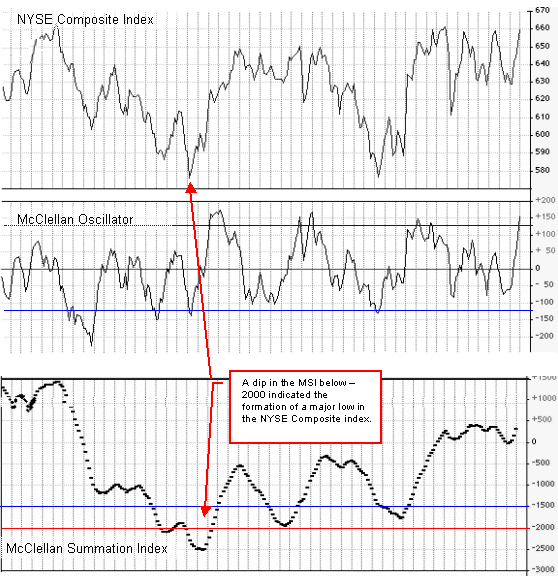
The McClellan Summation Index (MSI) is a cumulative total of the McClellan Oscillator, useful for intermediate to long term trading. Both are based on the movements of a market Index (i.e., NYSE) rather than an individual stock. Major tops tend to occur when the MSI goes above +1500. Major bottoms tend to occur when the MSI dips below -1500 (the -2000 level may provide more reliable signals - see example below).