Triple Tops
The Pattern: Triple tops occur in
uptrends and signal a trend reversal when the uptrend is broken to the
downside. The pattern consists of three consecutive tops that should peak at
the same level or, at consecutive lower highs.
Volume:
The first peak should occur on
stronger volume than the second and third peak. The pattern
should exhibit a decrease in up volume as the three peaks are formed.
Entry Point: The optimal entry point is a short position when the stock
trades through and below the current uptrend (thin red line).
Target: The target can be measured by taking the difference from the top
of the highest peak and support (thick blue line), and subtracting that figure
from support to arrive at your target.
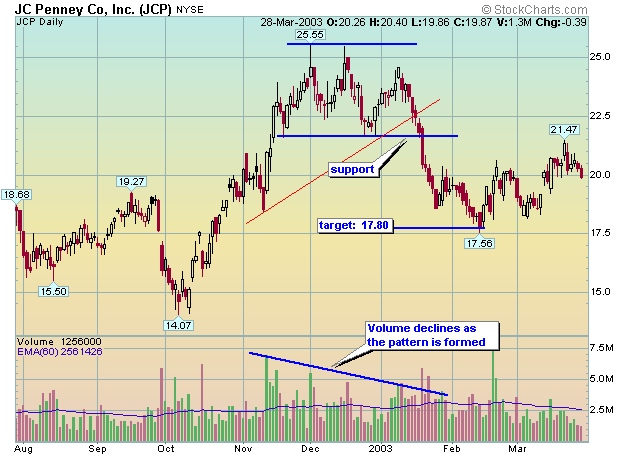
JCP traded into a triple top formation that occurred with strong volume on the left side of the pattern and low volume on the right side. It subsequently went on to trade below the uptrend (thin red line) and hit the target about four-weeks later.
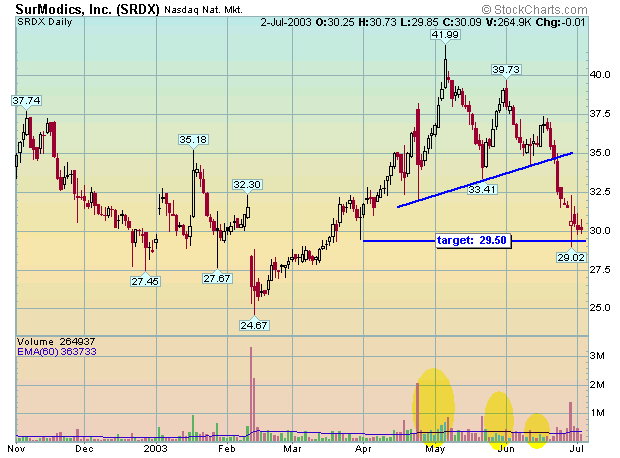
SRDX traded into a triple top formation that occurred with stronger volume on the left peak and decreasing volume on the subsequent peaks. This pattern formed with bottoms and peaks that occurred at different levels. It is important to note that each subsequent peak has to be lower than the previous one. The bottoms can occur at the same or a higher level. It subsequently went on to trade below the uptrend (thick blue line) and hit the target five-days later. Determining targets on patterns that form with multiple peaks is more challenging that determining targets on tops that form at the same level. In this instance, you should use a combination of the height of the peaks and a recent low.
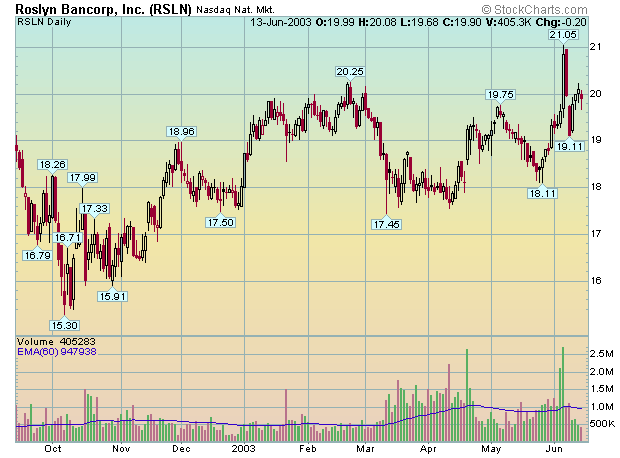
There is a triple top formation on this chart of RSLN.
Triple Bottoms
The Pattern: Triple bottoms occur in
downtrends and signal a trend reversal when the downtrend is broken to the
upside. The pattern consists of three consecutive bottoms that don't
necessarily have to occur at the same level. The first bottom signals the end
of the prior trend. Ideally, you want to see the second bottom occur at a level
slightly higher than the first bottom, and the third bottom to occur at a level
slightly higher than the second.
Volume:
The first bottom should begin on
strong selling volume and end on strong buying volume. The
second bottom should occur on lighter selling volume than the first, and the
third bottom should occur on lighter selling volume than the second. Buying
volume is of greater importance. You should look for an increase in volume as
each subsequent bottom is formed.
Entry Point: The optimal entry point is a long position when the stock
trades through and above the current downtrend (thin red line).
Target: The target can be determined by taking the difference of the
lowest bottom and resistance (thick blue line), and adding that figure to
resistance to arrive at your target.
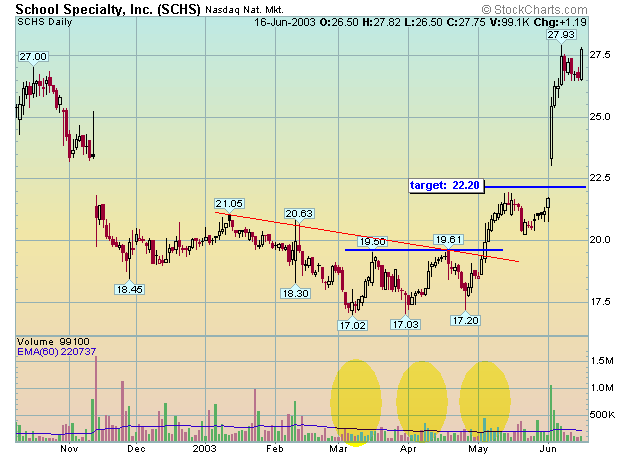
SCHS traded into a triple bottom formation that didn't occur with a noticeable difference in down volume - remember, up volume is more important than down volume in bottom formations. As expected, up volume did increase as each bottom was formed. It subsequently went on to trade above the downtrend (thin red line) and just came shy of hitting the target two-weeks later. SCHS went on to exceed the target in early June.
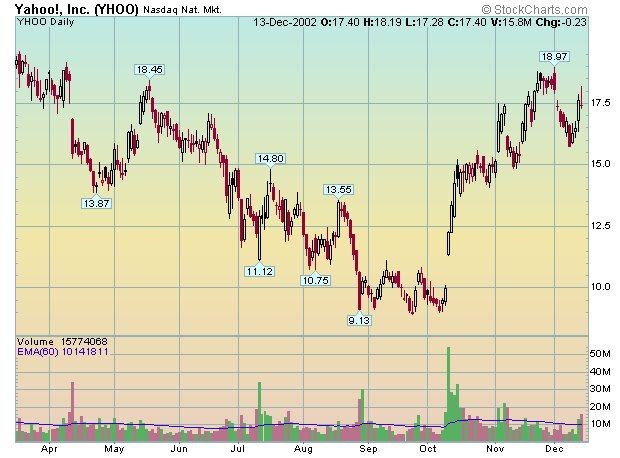
There is a triple bottom formation on this chart of YHOO.
Trading 101 Chart Patterns Ascending / Descending Triangles