
Ascending Triangles
The Pattern: The ascending triangle is a
bullish formation that occurs in uptrends. The pattern is characterized with a
series of higher lows that end with at least two equal highs. The formation
typically spans over several months.
Volume:
Volume should be strong in the beginning of the pattern and
remain quiet as the stock consolidates during the formation of the pattern.
There should be a sudden increase in volume as the pattern is broken to the
upside.
Entry Point: The optimal entry point is a long position when the stock
trades through and above the top of the triangle (resistance).
Target: The target can be determined by measuring the widest portion of
the pattern and adding that figure to the top of the pattern (resistance).
MANU traded into an ascending triangle formation that began on strong volume and formed on quiet volume. It subsequently traded above resistance on strong volume and hit the target approximately three, and four-weeks later.
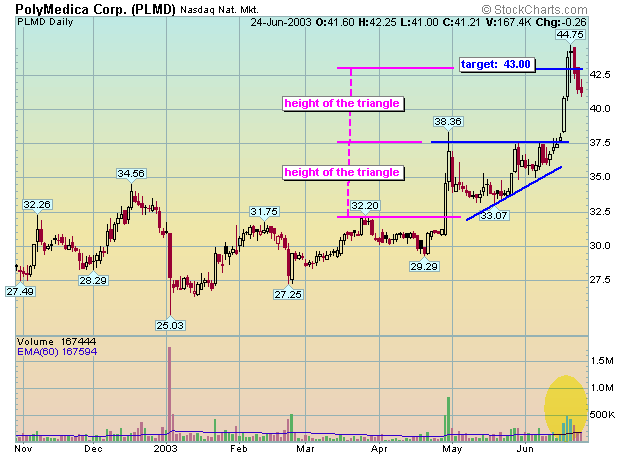
PLMD traded into an ascending triangle formation that began on strong volume and formed on quiet volume. It subsequently traded above resistance on strong volume, and exceeded the target four-days later.
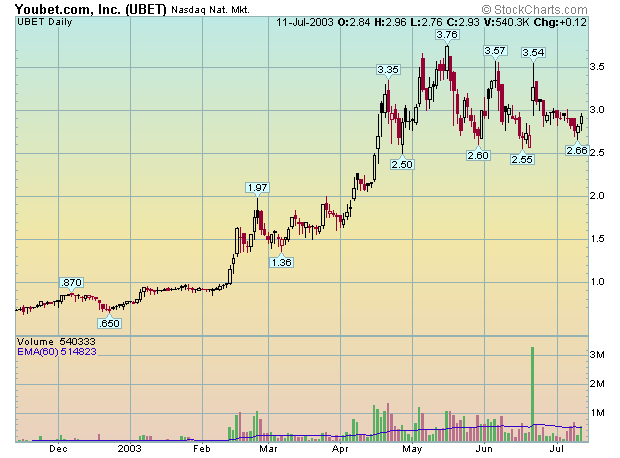
There is an ascending triangle formation on this chart of UBET.
Descending Triangles
The Pattern: The descending triangle is a
bearish formation that occurs in downtrends. The pattern is characterized with
a series of lower highs that end with at least two equal lows. The formation
typically spans over several months.
Volume:
Volume should be strong in the beginning of the pattern and
remain quiet as the stock consolidates during the formation of the pattern. A
sudden increase in volume isn't necessary as the stock trades below support.
Entry Point: The optimal entry point is a short position when the stock
trades through and below the bottom of the triangle (support).
Target: The target can be determined by measuring the widest portion of
the pattern and subtracting that figure from the bottom of the pattern
(support).

ATVI traded into an descending triangle formation that began on strong volume and formed on varying volume. It subsequently traded below support on fairly strong volume, and hit the target seven-days later. Notice the huge surge in sellers at the bottom - there are always plenty of sellers at the bottom.

BRCD traded into an descending triangle formation that actually began on light volume and formed on average to light volume. It subsequently traded below support on very light volume, and hit the target approximately one-month later. Notice the huge surge in sellers at the bottom - there are always plenty of sellers at the bottom.
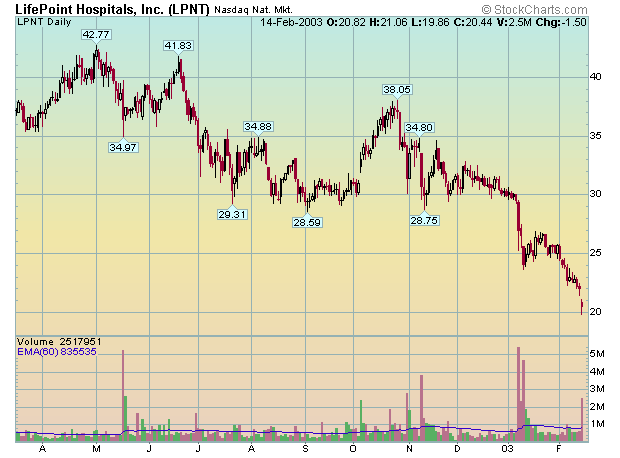
There is a descending triangle formation on this chart of LPNT.
Trading 101 Chart Patterns Cup and Handle