Bullish Symmetrical Triangles
The Pattern: The bullish symmetrical
triangle is similar to the bullish pennant formation except that it forms over a
longer period of time, usually more than 8 weeks. It is a continuation pattern
that consists of a consolidation period before a continuation of the prevailing
trend.
Volume:
The beginning of the triangle is usually formed on heavy volume
while the remainder of the pattern is formed on light volume. In a bullish
symmetrical triangle, there should be a noticeable surge in volume as the stock
trades above the upper boundary of the pattern.
Entry Point: The optimal entry point for a bullish triangle is a long
position when the stock trades through and above the top of the pattern
(resistance).
Target: The target can be determined by measuring the widest part of the
triangle and adding that number to the top of the pattern (resistance).
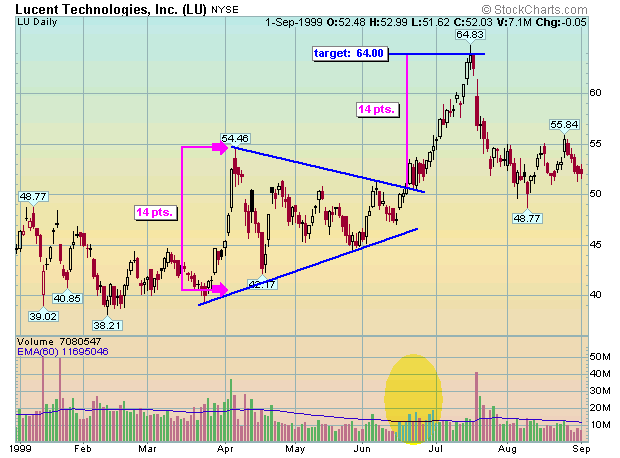
LU traded into a bullish symmetrical triangle formation that occurred in an uptrend. The pattern began on high volume and consolidated on noticeably low volume. It subsequently traded above resistance on strong volume and hit the target approximately four-weeks later.
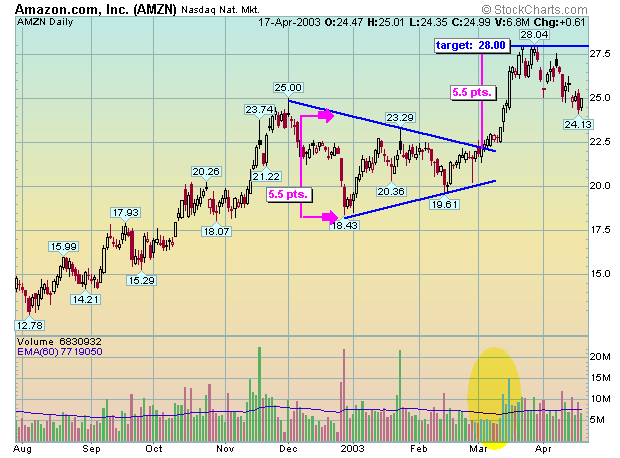
AMZN traded into a bullish symmetrical triangle formation that occurred in an uptrend. The pattern began on high volume and consolidated on average to low volume. It subsequently traded above resistance on less than average volume. The strong volume showed up about a week later and the stock hit the target approximately three-weeks later.

There is a symmetrical triangle formation on this chart of NLY.
Bearish Symmetrical Triangles
The Pattern: The bearish symmetrical
triangle is similar to the bearish pennant formation except that it forms over a
longer period of time, usually more than 8 weeks. It is a continuation pattern
that consists a consolidation period before a continuation of the prevailing
trend.
Volume:
The beginning of the triangle is usually formed on heavy volume
while the remainder of the pattern is formed on light volume. In a bearish
symmetrical triangle, a surge in volume is not needed for the stock to
successfully trade below the lower boundary. The surge in volume should occur
at or near the target of the pattern.
Entry Point: The optimal entry point for a bearish triangle is a short
position when the stock trades through and below the bottom of the pattern
(support).
Target: The target can be determined by measuring the widest part of the
triangle and subtracting that number from the bottom of the pattern (support).
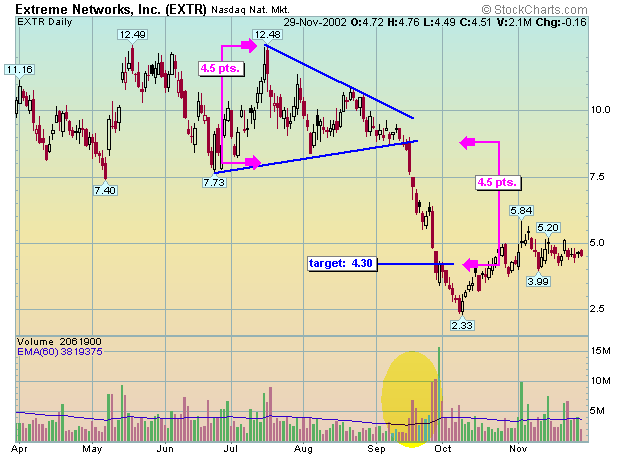
EXTR traded into a bearish symmetrical triangle that occurred in an downtrend. The beginning of the pattern was formed on strong volume while the end of the pattern formed on volume that was well below average. It subsequently traded below support on very low volume. The stock went on to trade through the target two-weeks later. Notice the huge surge in sellers at the bottom - there are always plenty of sellers at the bottom.
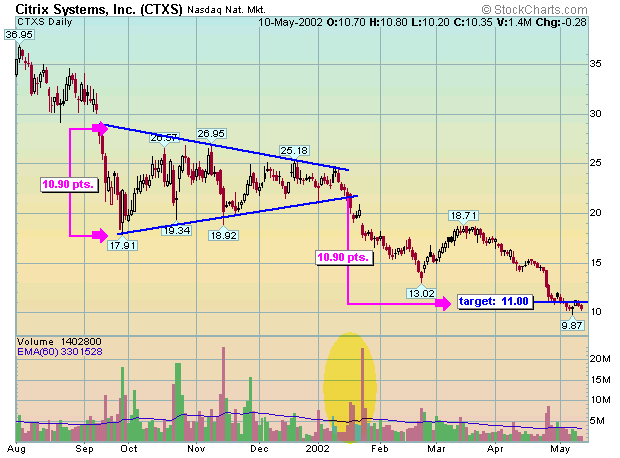
CTXS traded into a bearish symmetrical triangle that occurred in an downtrend. The beginning of the pattern was formed on strong volume while the end of the pattern formed on volume that was well below average. It subsequently traded below support on fairly strong volume. Notice the surge in selling occurred shortly after support was broken. It took CTXS nearly four months to hit the target because most of the sellers were exhausted soon after the stock traded below the pattern. Keep a close watch on volume during break downs. You want the surge in volume to occur right at or just before the target. If the surge occurs shortly after the break down it is an indication that it will either fail to hit the target or take an extended period of time to do so.
Trading 101 Chart Patterns Trendlines