Bullish Trend Lines
The Pattern: Bullish trend lines
generally fall outside the ranges of all other patterns and usually have a
general trend or price range the acts as resistance.
Volume:
The beginning of the consolidation period is usually formed on
strong volume, and the consolidation phase is usually formed on quiet volume.
There should be an sudden increase in volume as the pattern is broken to the
upside.
Entry Point: The optimal entry point is a long position when the stock
trades through and above the top of the trend line (resistance).
Target: The target can be determined by measuring the widest portion of
the consolidation phase and adding that number to resistance or, choosing a
recent high and using that as the target.
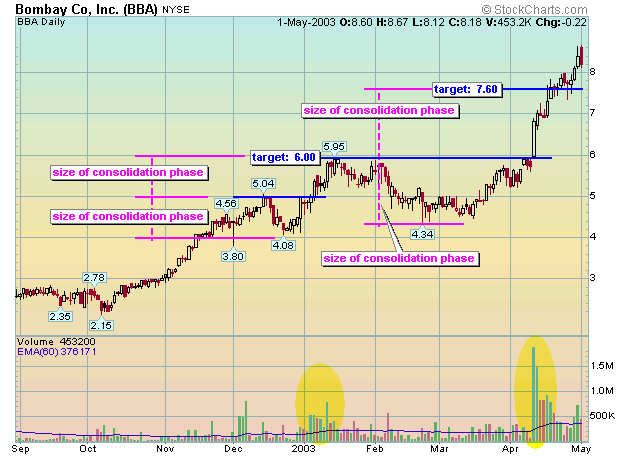
BBA formed two distinct levels of resistance during this upward advance. It made six attempts at clearing $5 before it cleared the hurdle on strong volume, in early January '03. No distinct pattern was formed. There was just a hurdle at $5. The target was projected by taking the difference of resistance and the bottom of the consolidation phase, and adding that number to resistance. BBA stopped right on the target on this move.
Next, BBA traded into what looks like an inverted head and shoulders with resistance at $6. Only, inverse head and shoulders are bottom reversal patterns. This was a continuation pattern and doesn't fall into any distinct category. There was just a hurdle at $6. BBA traded over $6 on very heavy volume and exceeded the target in a little over one-week.
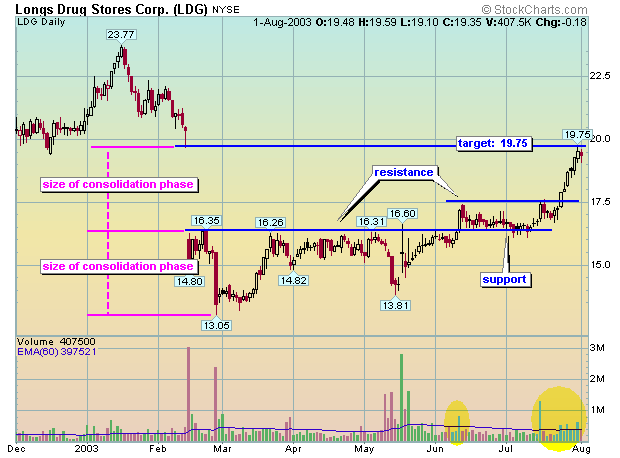
LDG traded into a consolidation phase after gapping down in mid-February. It traded sideways for approximately four-months before it tried to tackle the bottom of the gap, which was a solid level of resistance. There is no distinct pattern during the consolidation phase. There was just a stiff level of resistance at 16.35. The stock finally traded over this level, on strong volume, in the second week of June. It later found support on what was prior resistance, and established another level of resistance at 17.50. Shortly thereafter, LDG cleared that hurdle on above average, and increasing volume. The stock moved on to the target in late July.
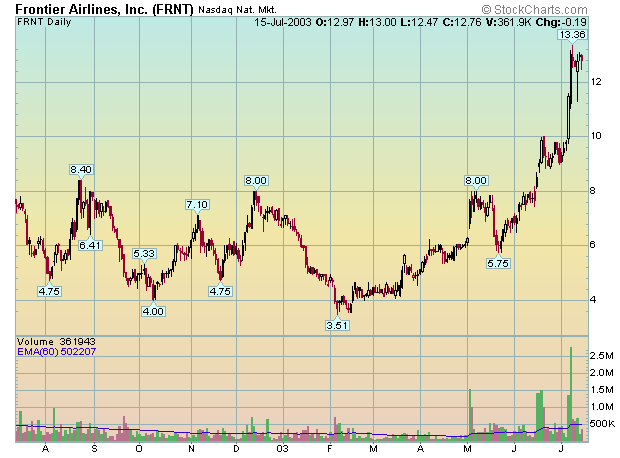
There is a trend line on this chart of FRNT.
Bearish Trend Lines
The Pattern: Bearish trend lines
generally fall outside the ranges of all other patterns and usually have a
general trend or price range that acts as support.
Volume:
The beginning of the consolidation period is usually formed on
strong volume, and the consolidation phase is usually formed on quiet volume.
There is no need for a surge in volume if the trend line is broken to the
downside.
Entry Point: The optimal entry point is a short position when the stock
trades through and below the bottom of the trend line (support).
Target: The target can be determined by measuring the widest portion of
the consolidation phase and subtracting that number from support or, choosing a
recent low and using that as the target.
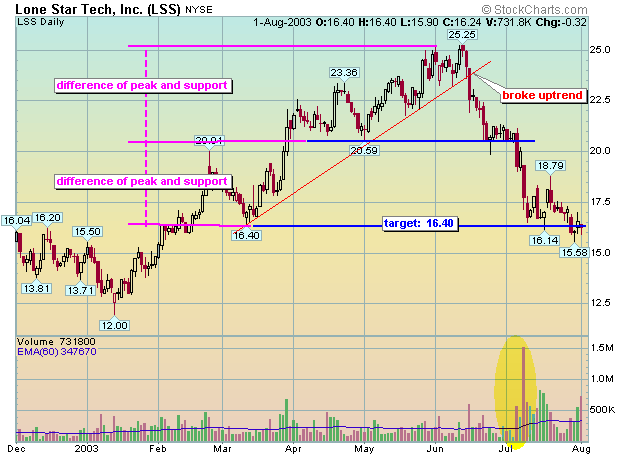
LSS broke the uptrend (thin red line) and found support at the previous low of 20.59. The formation comes close to a head and shoulders pattern except that the right shoulder is almost non-existent. The stock traded below this level and came just shy of the target four-days later. Notice the surge of sellers at the target.
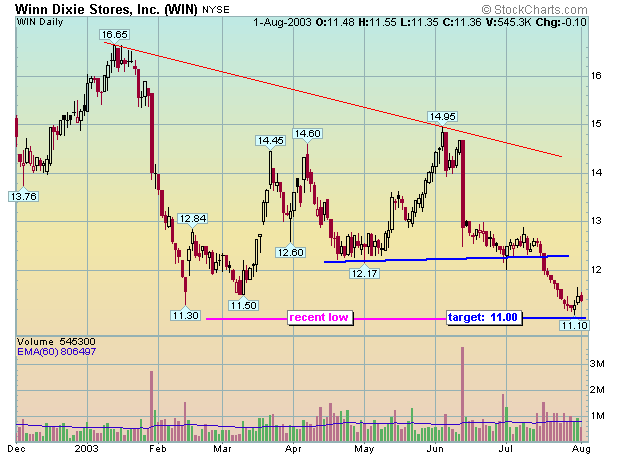
WIN developed a trend line from April to July. The formation comes close to a head and shoulders pattern except that the stock is still in a downtrend as is illustrated by the thin red line. There is also an absence of both the left and right shoulder. The stock traded below the trend line and came just shy of hitting the target in just under two-weeks.
Trading 101 Chart Patterns