Flags
The Pattern: The flag formation is a
continuation pattern that consists a consolidation period before a continuation
of the prevailing trend. The flag pattern usually forms over a period of 4-8
weeks. A pattern beyond 8 weeks is more consistent with a rectangle
formation.
Volume:
The beginning of the flag is usually formed on heavy volume while
the remainder of the pattern is formed on light volume. In a bullish flag,
there should be a noticeable surge in volume as the stock trades above the upper
boundary of the pattern. In a bearish flag, a surge in volume is not needed for
the stock to successfully trade below the lower boundary. The surge in volume
should occur at or near the target of the pattern.
Entry Point: The optimal entry point for a bullish flag is a long
position when the stock trades through and above the top of the pattern
(resistance). The optimal entry point for a bearish flag is a short position
when the stock trades through and below the bottom of the pattern (support).
Target: The target can be determined by measuring the length of the flag
pole, which is the distance from the previous level of support or resistance,
and adding or subtracting that figure to the current level of support or
resistance. See examples below.
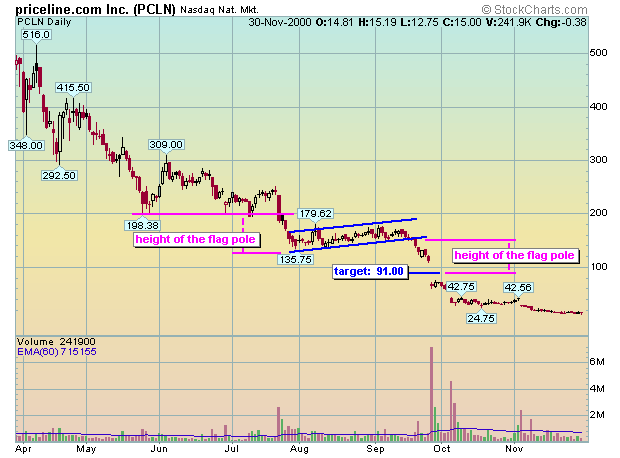
In early August, PCLN traded into a bearish flag pattern after breaking down from the descending triangle. The beginning of the pattern was formed on heavy volume while the remainder of the pattern was formed on light volume. The stock eventually went on to break support and, shortly thereafter, gapped down to exceed the target.
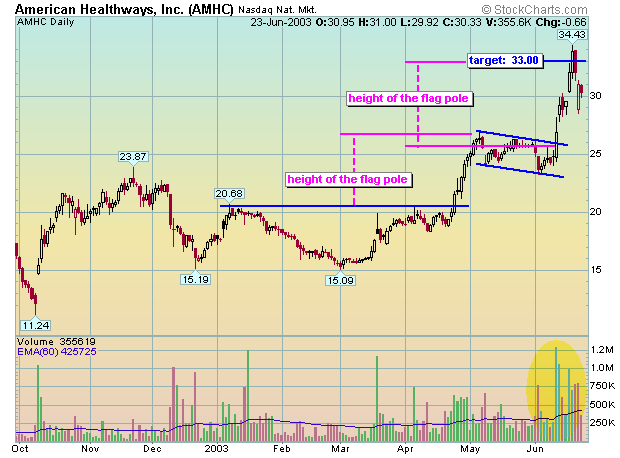
AMHC traded into a bullish flag pattern after breaking out from a consolidation pattern that began in early 2003. The beginning of the pattern was formed on heavy volume while the remainder of the pattern was formed on light volume. The stock eventually broke out of the pattern on strong volume, and exceeded the target in a little over one-week.

There is a bullish flag formation on this chart of MACR. answer.
Pennants
The Pattern: The pennant formation is a
continuation pattern that consists a consolidation period before a continuation
of the prevailing trend. The pennant pattern usually forms over a period of 4-8
weeks. A pattern beyond 8 weeks is more consistent with a symmetrical triangle
formation.
Volume:
The beginning of the pennant is usually formed on heavy volume
while the remainder of the pattern is formed on light volume. In a bullish
pennant, there should be a noticeable surge in volume as the stock trades above
the upper boundary of the pattern. In a bearish pennant, a surge in volume is
not needed for the stock to successfully trade below the lower boundary. The
surge in volume should occur at or near the target of the pattern.
Entry Point: The optimal entry point for a bullish pennant is a long
position when the stock trades through and above the top of the pattern
(resistance). The optimal entry point for a bearish pennant is a short position
when the stock trades through and below the bottom of the pattern (support).
Target: The target can be determined by measuring the length of the flag
pole, which is the distance from the previous level of support or resistance,
and adding or subtracting that figure to/from the current level of support or
resistance. See examples below.
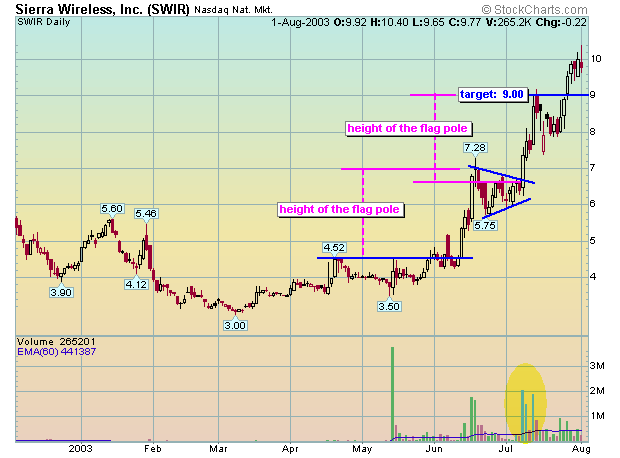
SWIR traded into a bullish pennant pattern that began with heavy volume and formed on light volume. The stock eventually went on to break out on strong volume, and hit the target in approximately one-week.

CMOS traded into a bearish pennant pattern that began with heavy volume and formed on light volume. The stock eventually went on to break support and hit the target in approximately three-weeks. Notice the lack of volume when the stock broke support. You don't need an increase in volume when a stock breaks support. Also, notice the increase in volume when the stock hits the target - there are always plenty of sellers at the bottom.
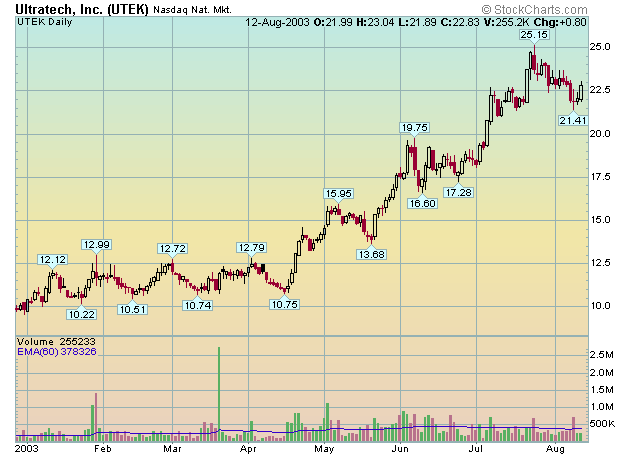
There is a bullish pennant formation on this chart of UTEK. the answer.
Trading 101 Chart Patterns Symmetrical Triangles