
Double Tops
The Pattern: Double tops occur in
uptrends and signal a reversal of the previous trend. The pattern consists of
two consecutive tops that peak at almost the same level.
Volume:
The first peak should be formed on strong buying volume while the
second peak should be formed on a noticeable drop in volume, as compared to the
first peak.
Entry Point: The optimal entry point is a short position when the stock
trades through and below the current uptrend (thin red line).
Target: The target can be measured by taking the difference from the top
of the peak and support (thick blue line), and subtracting that figure from
support to arrive at your target.
BBOX traded into a double top formation that occurred with stronger volume on the left peak and low volume on the right peak. It subsequently went on to trade below the uptrend (thin red line) and fell just shy of hitting the target - targets are not an exact science. Sometimes they get hit, sometimes they don't, and sometimes they get exceeded.

AT traded into a double top formation that occurred with volume that was very similar on each peak. The important distinction here is that AT formed the second peak on a three day buying spree, and then subsequently collapsed. AT traded through and below the uptrend (thin red line) and hit it's target in approximately four-weeks.
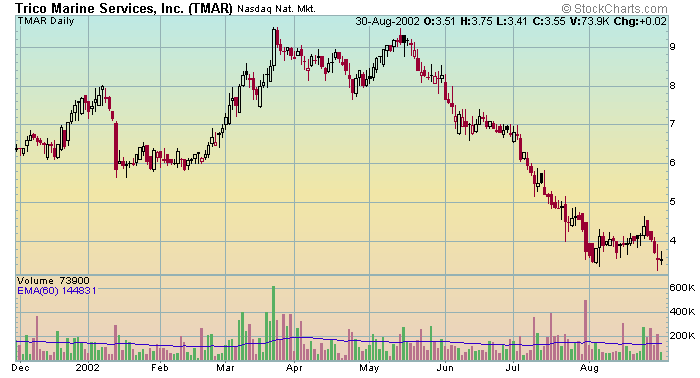
There is a double top formation on this chart of TMAR.
Double Bottoms
The Pattern: Double bottoms occur in
downtrends and signal a reversal of the previous trend. The pattern consists of
two consecutive bottoms that don't necessarily have to occur at the same level.
The first bottom signals the end of the prior trend. Ideally, you want to see
the second bottom occur at a level slightly higher than the first bottom.
Volume:
The first bottom should begin on
strong selling volume and end on strong buying volume. The
second bottom should occur on lighter selling volume, and end on equal or
greater buying volume.
Entry Point: The optimal entry point is a long position when the stock
trades through and above the current downtrend (thin red line).
Target: With double bottoms you can determine two targets. The first
target would be calculated by subtracting the higher bottom from resistance
(thick blue line) and adding that figure to resistance. The second target can
be determined by subtracting the lower bottom from resistance and adding that
figure to resistance.
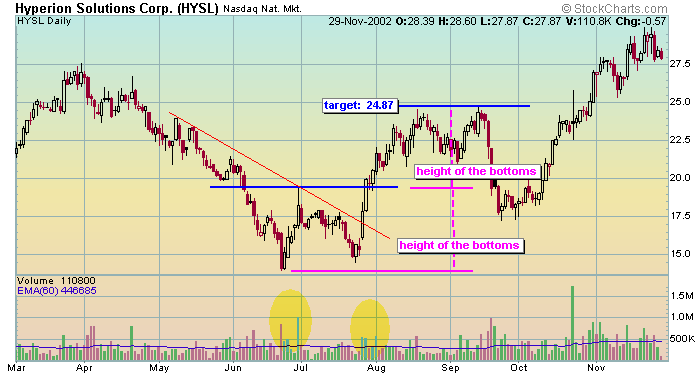
HYSL traded into a double bottom formation that occurred with strong selling and strong buying volume on the left bottom. The right bottom began with light selling volume and ended with strong buying volume. Since the bottoms occurred at nearly the same price you can use one target. HYSL subsequently went on to trade above the downtrend (thin red line) and just came shy of hitting the target two-weeks later. HYSL eventually hit the target in the middle of September.
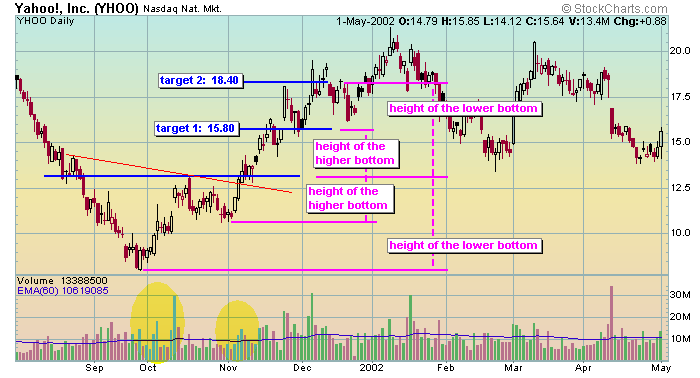
YHOO traded into a double bottom formation that occurred with strong selling and strong buying volume on the left bottom. The right bottom began with light selling volume and ended with strong buying volume. We can calculate two targets, since YHOO traded into a double bottom pattern with two distinct price levels. It subsequently went on to trade above the downtrend (thin red line) and hit the targets in two and four-weeks, respectively.
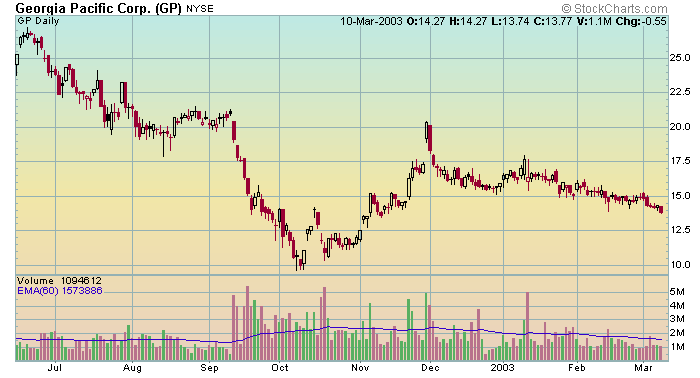
There is a double bottom reversal formation on this chart of GP. answer.
Trading 101 Chart Patterns Head and Shoulders