|
Moving Averages - Part 2 Part 1 | Part 2 |
| Moving Averages |
Trend-Following Indicator
Moving averages smooth out a data series and make it easier to identify the
direction of the trend. Because past price data is used to form moving averages,
they are considered lagging, or trend following, indicators. Moving averages
will not predict a change in trend, but rather follow behind the current trend.
Therefore, they are best suited for trend identification and trend following
purposes, not for prediction.
When to Use
Because moving averages follow the trend, they work best when a security is
trending and are ineffective when a security moves in a trading range. With this
in mind, investors and traders should first identify securities that display
some trending characteristics before attempting to analyze with moving averages.
This process does not have to be a scientific examination. Usually, a simple
visual assessment of the price chart can determine if a security exhibits
characteristics of trend.
In its simplest form, a security's price can be doing only one of three things: trending up, trending down or trading in a range. An uptrend is established when a security forms a series of higher highs and higher lows. A downtrend is established when a security forms a series of lower lows and lower highs. A trading range is established if a security cannot establish an uptrend or downtrend. If a security is in a trading range, an uptrend is started when the upper boundary of the range is broken and a downtrend begins when the lower boundary is broken.
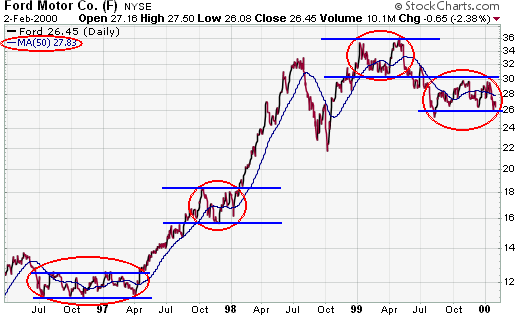
Ford
In the Ford example, it is evident that a stock can go through both trending and trading phases. The red circles indicate trading range phases that are interspersed among trending periods. It is sometimes difficult to determine when a trend will stop and a trading range will begin or when a trading range will stop and a trend will begin. The basic rules for trends and trading ranges laid out above can be applied to Ford. Notice the trading range periods, the breakouts (both up and down) and the trending periods. The moving average worked well in times of trend, but faired poorly in times of trading. Also note how the moving average lags behind the trend: it is always under the price during an uptrend and above the price during a downtrend. A 50-day simple moving average was used for this example. However, the number of periods is optional and much will depend on the characteristics of the security as well as an individual's trading and investing style.
Coca-Cola
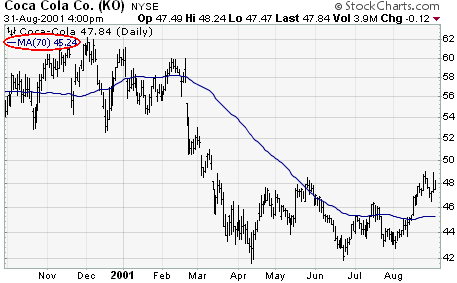
If price movements are choppy and erratic over an extended period of time, then a moving average is probably not the best choice for analysis. The chart for Coca-Cola shows a security that moved from 60 to 40 in a couple months in 2001. Prior to this decline, the price gyrated above and below its moving average. After the decline, the stock continued its erratic behavior without developing much of a trend. Trying to analyze this security based on a moving average is likely to be a lesson in futility.
Time Warner
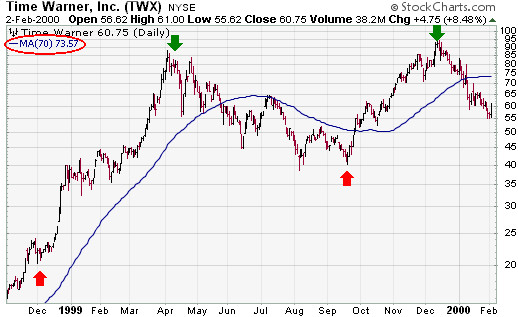
A quick look at the chart for Time Warner shows a different picture than for MMM. Over the same time period, Time Warner has shown the ability to trend. There are 3 distinct trends or price movements that extend for a number of months. Once the stock moves above or below the 70-day SMA, it usually continues in that direction for a little while longer. MMM, on the other hand, broke above and below its 70-day SMA numerous times and would have been prone to numerous whipsaws. A longer moving average would probably work better for MMM, but it is clear that there are fewer characteristics of trend than in Time Warner.
Moving Average Settings
Once a security has been deemed to have enough characteristics of trend, the
next task will be to select the number of moving average periods and type of
moving average. The number of periods used in a moving average will vary
according to the security's volatility, trendiness and personal preferences. The
more volatility there is, the more smoothing that will be required and hence the
longer the moving average. Stocks that do not exhibit strong characteristics of
trend may also require longer moving averages. There is no one set length, but
some of the more popular lengths include 21, 50, 89, 150 and 200 days as well as
10, 30 and 40 weeks. Short-term traders may look for evidence of 2-3 week trends
with a 21-day moving average, while longer-term investors may look for evidence
of 3-4 month trends with a 40-week moving average. Trial and error is usually
the best means for finding the best length. Examine how the moving average fits
with the price data. If there are too many breaks, lengthen the moving average
to decrease its sensitivity. If the moving average is slow to react, shorten the
moving average to increase its sensitivity. In addition, you may want to try
using both simple and exponential moving averages. Exponential moving averages
are usually best for short-term situations that require a responsive moving
average. Simple moving averages work well for longer-term situations that do not
require a lot of sensitivity.
| Uses for Moving Averages |
There are many uses for moving averages, but three basic uses stand out:
Trend Identification/Confirmation
There are three ways to identify the direction of the trend with moving
averages: direction, location and crossovers.
The first trend identification technique uses the direction of the moving average to determine the trend. If the moving average is rising, the trend is considered up. If the moving average is declining, the trend is considered down. The direction of a moving average can be determined simply by looking at a plot of the moving average or by applying an indicator to the moving average. In either case, we would not want to act on every subtle change, but rather look at general directional movement and changes.
Disney
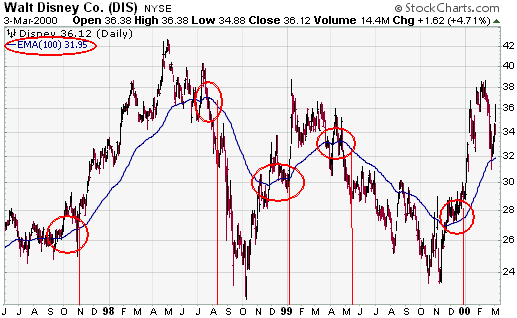
In the case of Disney, a 100-day exponential moving average (EMA) has been used to determine the trend. We do not want to act on every little change in the moving average, but rather significant upturns and downturns. This is not a scientific study, but a number of significant turning points can be spotted just based on visual observation (red circles). A few good signals were rendered, but also a few whipsaws and late signals. Much of the performance would depend on your entry and exit points. The length of the moving average influences the number of signals and their timeliness. Moving averages are lagging indicators. Therefore, the longer the moving average is, the further behind the price movement it will be. For quicker signals, a 50-day EMA could have been used.
The second technique for trend identification is price location. The location of the price relative to the moving average can be used to determine the basic trend. If the price is above the moving average, the trend is considered up. If the price is below the moving average, the trend is considered down.
Cisco
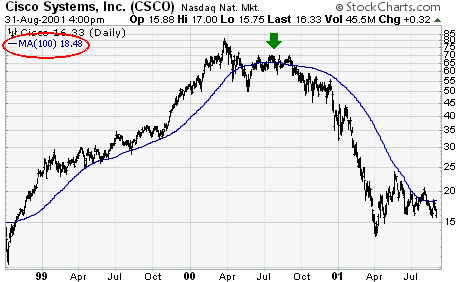
This example is pretty straightforward. The long-term for CSCO is determined by the location of the stock relative to its 100-day SMA. When CSCO is above its 100-day SMA, the trend is considered bullish. When the stock is below the 100-day SMA, the trend is considered bearish. Buy and sell signals are generated by crosses above and below the moving average. There was a brief sell signal generated in Aug-99 and a false buy signal in July-00. Both of these signals occurred when Cisco's trend began to weaken. For the most part though, this simple method would have kept an investor in throughout most of the bull move.
The third technique for trend identification is based on the location of the shorter moving average relative to the longer moving average. If the shorter moving average is above the longer moving average, the trend is considered up. If the shorter moving average is below the longer moving average, the trend is considered down.
Inter-Tel
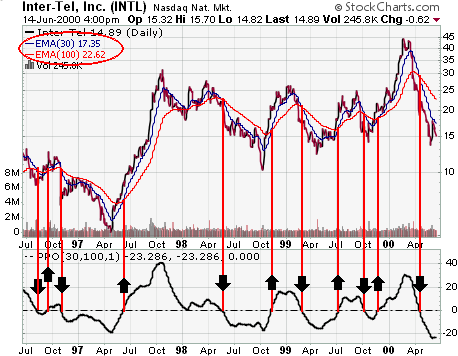
For Inter-Tel, a 30/100 moving average crossover was used to determine the trend. When the 30-day moving average moves above the 100-day moving average, the trend is considered bullish. When the 30-day moving average declines below the 100-day moving average, the trend is considered bearish. A plot of the 30/100 differential is plotted below the price chart by using the Percentage Price Oscillator (PPO) set to (30,100,1). When the differential is positive the trend is considered up -- when it is negative the trend is considered down. As with all trend-following systems, the signals work well when the stock develops a strong trend, but are ineffective when the stock is in a trading range. Also notice that the signals tend to be late and after the move has begun. Again, trend following indicators are best for identification and following, not predicting.
Support and Resistance Levels
Another use of moving averages is to identify support and resistance levels.
This is usually accomplished with one moving average and is based on historical
precedent. As with trend identification, support and resistance level
identification through moving averages works best in trending markets.
Sun Microsystems
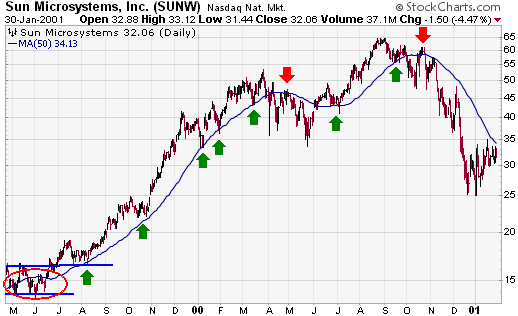
After breaking out of a trading range, Sun Microsystems successfully tested moving average support in late July and early August. Also notice that the June resistance breakout near 18 turned into support. Therefore, the moving average acted as a confirmation of resistance-turned-support. After this first test, the 50-day moving average went on to 4 more successful support tests over the next several months. A break of support from the 50-day moving average would serve as a warning that the stock may move into a trading range or may be about to change the direction of the trend. Such a break occurred in Apr-00 and the 50-day SMA turned into resistance later that month. When the stock broke above the 50-day SMA in early Jun-00, it returned to a support level until the Oct-00 break. In Oct-00, the 50-day SMA became a resistance level and that held for many months.