|
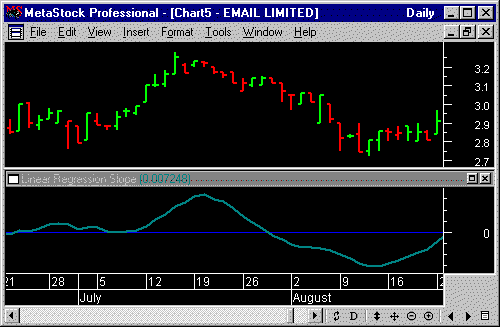
Linear Regression Slope

Description
The Linear
Regression method provides several
useful outputs for technical analysts,
including the Slope. The Slope shows how
much prices are expected to change per
unit of time. Some may remember this as
“rise over run.”
Interpretation
It is
helpful to consider Slope in relation to
r-squared.
While Slope gives you the general
direction of the trend (positive or
negative),
r-squared gives you the strength of
the trend. A high r-squared value can be
associated with a high positive or
negative Slope.
When the
Slope of the trend first becomes
significantly positive, you could open a
long position. You could sell, or open a
short position when the Slope first
becomes significantly negative. You
should refer to the table below to
determine when a trend is deemed
“significant.” For example, if the
14-period Slope has recently turned from
negative to positive (i.e., crossed
above zero), you may consider buying
when r-squared
crosses above the 0.27 level.
To
determine if the trend is statistically
significant for a given x-period linear
regression line, plot the r-squared
indicator and refer to the following
table. This table shows the values of
r-squared required for 95% confidence
level at various time periods. If the
value is less than the critical values
shown, you should assume that prices
show no statistically significant trend.
You may
even consider opening a short-term
position opposite the prevailing trend
when you observe the Slope rounding off
at extreme levels. For example, if the
Slope is at a relatively high level and
begins to turn down, you may consider
selling or opening a short position.
There are
numerous ways to use the linear
regression outputs of Slope and
r-squared in
trading systems. For more detailed
coverage, refer to the book The New
Technical Trader by Tushar
Chande and Stanley Kroll. |