| 12:35 pm, correct? |
|
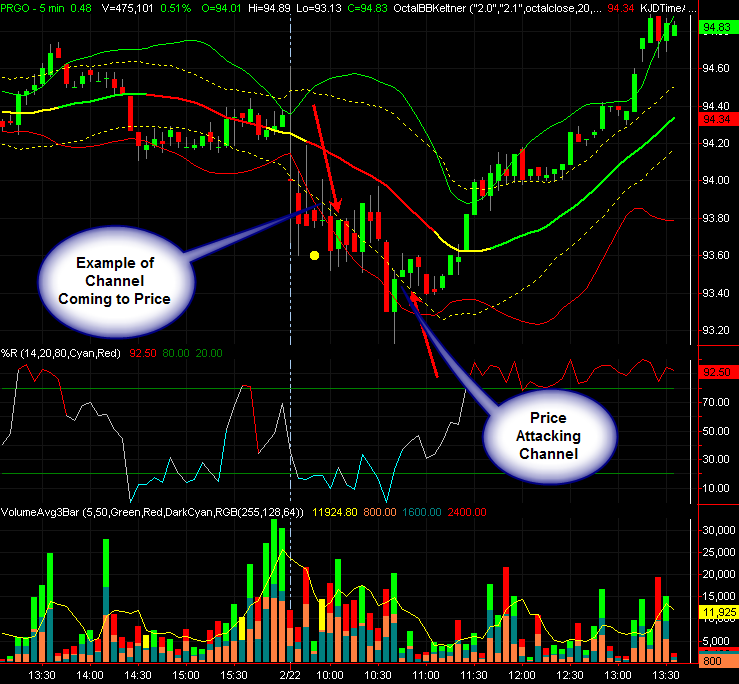
Tachy, Thanks a lot for this post that seems to tie together many of the aspects of your prior topics on trading with KCs, %R, Volatility, AvgVol, etc. Definitely worth the study time. While he hasn't posted in quite some time, I vaguely recall that Trend39 had posted a topic about a "retirement strat" that would take $250-500 from the market each day on high probability, low risk trades. Maybe this just might be such a "candidate." How long have you manually been trading this? Sure do appreciate the post! |
|
Since this idea is from a respected person like tachyonv, I am
rethinking my "no active trading stocks" policy! Nice work. THANKS! |
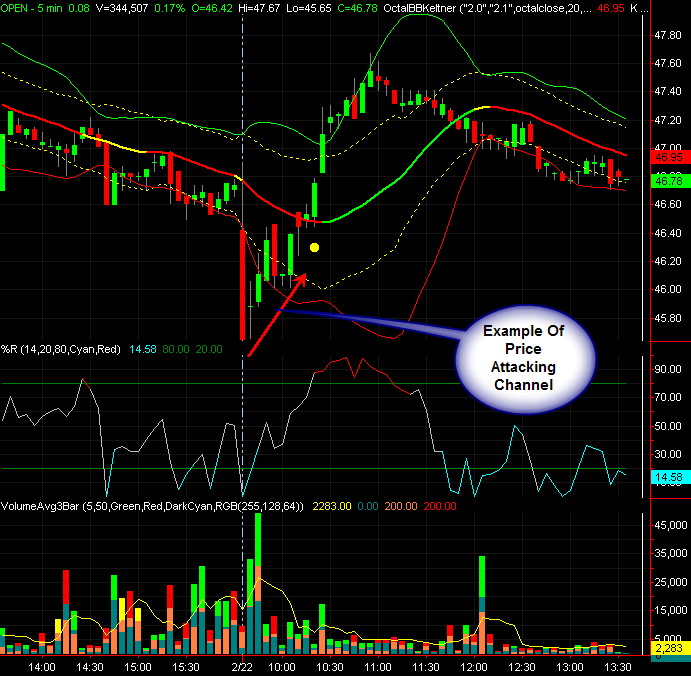
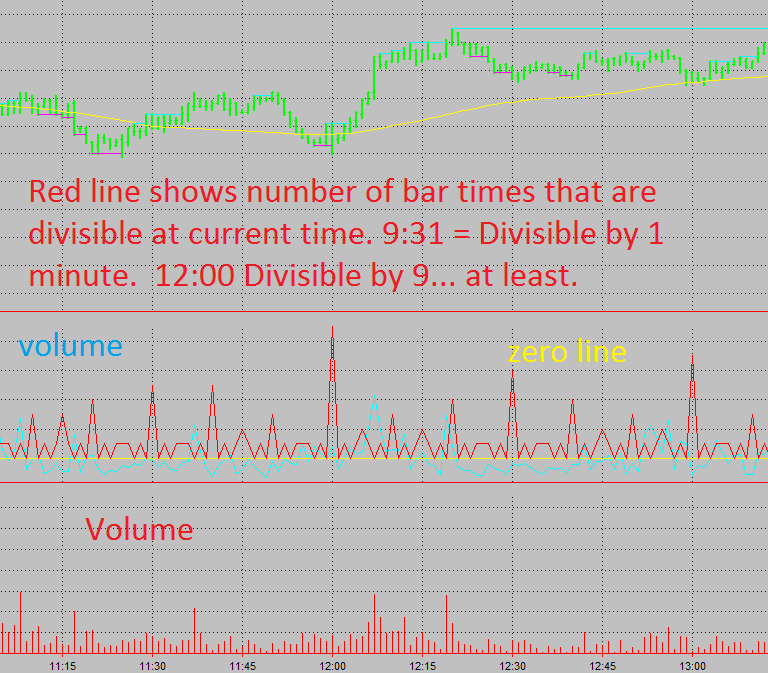
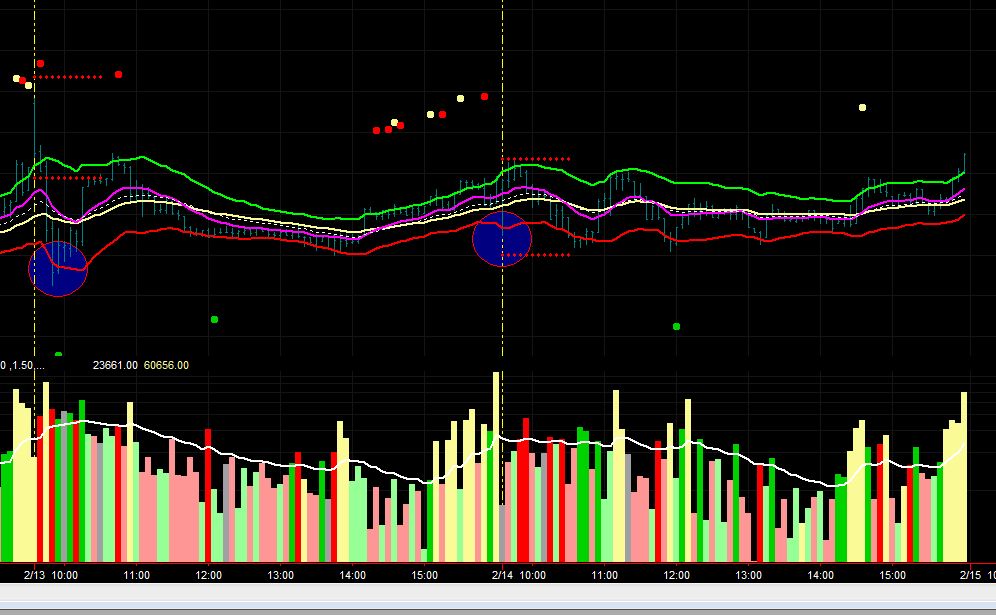
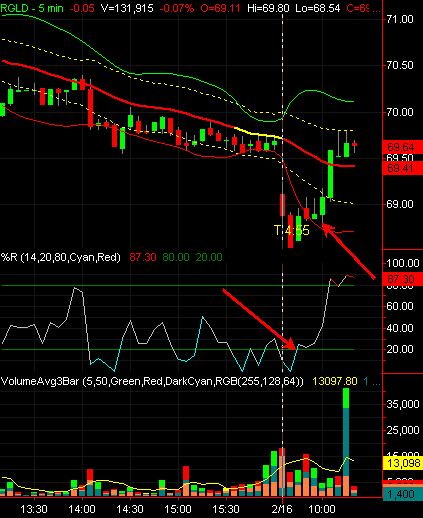
quote: When I was trading stocks with similar approach, I also selected stocks with these additional criteria: 1. Daily volume filter for high volume stocks, at least over 2 million shares per day, preferable over 5 million. Stocks that get traded heavily by institutions: Volume/Trade 2. Narrow spreads. 0.01 to 0.03 max 3. Range > 2 and < 5, my sweet spot (Used Range not ATR that includes gaps) 4. Look for Gaps - reversals after open and/or continuation setups, 10:00 to 10:30 ET RadarScreen, IBD tables TradingDude |
| Personally, I was afraid to ask. Hopefully those issues are nothing that will prevent you from trading into your 70s and 80s! |
| Tachyonv - good luck with your tests and a BIG thanks for sharing........... May god be with you.... |
|
Tachy, Thanks for the replies back answering my questions. Your contributions are awesome and you are a valued member of this community... Much appreciated! And, ditto. Good luck with your tests next month, which hopefully will be negative. My uncle had a benign enlarged prostate, took some meds and only watched and waited for 15+ years for "things" to get worse. They never did and he lived well into his early 80s. All the very best to you. |
quote: That is good to hear, compared to the alternative. Good luck with everything! |
|
I have not traded stocks in a very long time, but your
incredible generosity will cause me to rethink that. Best wishes
for your health and I hope we continue to enjoy your company on
the forum for a very long time. Tom |
|
Tachyonv, Many thanks for sharing this, its not often someone share's a methodolgy with a long track record so freely. I too havnt traded stocks for a while, preferring to trade 1 or 2 index futures for simplicity using some automated strats I bought from other forum members. These do make money over time but do also have long DD periods so thought I would have a look at your setup. I have setup a scan with the criteria you have mentioned but cant see how you can setup the range to be anything other than the default options 0-10 days ago. How do you setup a scan for the average range between 21 - 34 days ? Also, how does the 19% profit compare to previous 3-4 week periods? Is this a typical return for the time period ? What is your worst DD ? Hope everything goes well for you in the next few weeks. |
| Thanks for sharing. In the middle of something right now + grandkid stuff. Will give it a trade later. |
|
Tachy, Thru the yrs, I've developed several "assume real-world" ExitOnly AutoStrats and am just wondering... If a trader is able to monitor their computer's data-feed, what are your thoughts on using a StopLoss/ProfitTarget AutoStrat to facilitate managing multiple positions during the day as related to your 100% manual strat and based on your "lessons" from trading it? In advance, thank you! |
quote: Did you mean beta >=0.7? If not, approx. how many stocks is your screen returning as is? Thanks. |
| Extremely generous of you to share this tachyonv, especially in such detail as to make it easy to reproduce. Thanks and best of luck with the health stuff! |
|
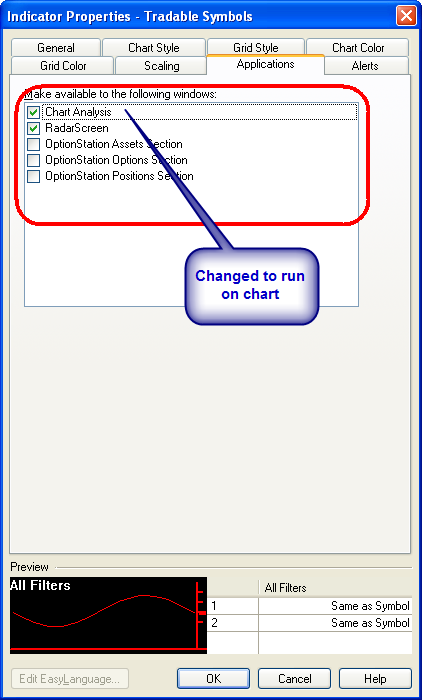
Does anyone have any updates on whether or
not the "Easy to Borrow" (ETB) and "Special Margin Requirements"
functionality has been added to the platform yet for use in the
RadarScreen? https://community.tradestation.com/Discussions/Topic.aspx?Topic_ID=33118&PAGE=25 (Page 25, 02/13/2012 16:22:06 Post) Thank you. |
quote: tachyonv, I've been trading since 1971 and using TS for a few years; I attend my local TS Users Group. But this is the most generous and clearly expressed, and, I assume profitable, technique that I've ever seen, including trading magazines and the 2 tons of my quant books. THANKS! I look forward to learning about this method even though I've been away from daytrading stocks for a long while. Is this method a tachyonv original, or what? BTW, of those with Prostate cancer, "Most men die with, not of, prostate cancer". http://www.cancerresearch.org/resources/what-to-do-if-prostate-cancer-strikes.html To your health, ant___ |
|
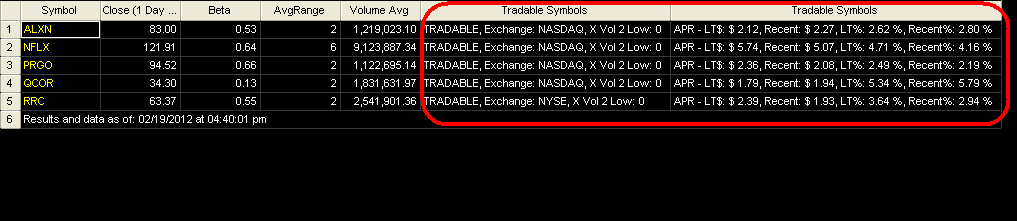
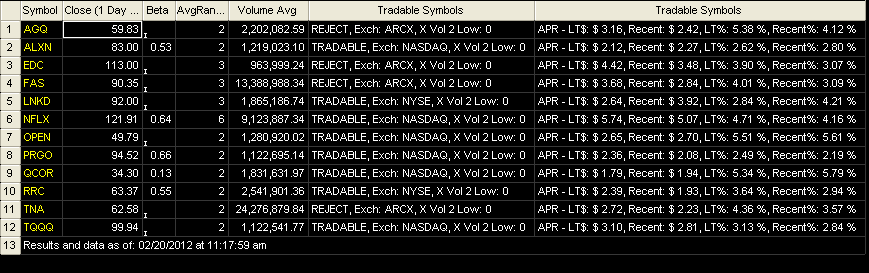
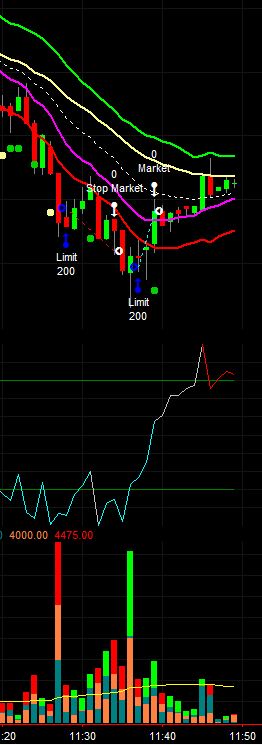
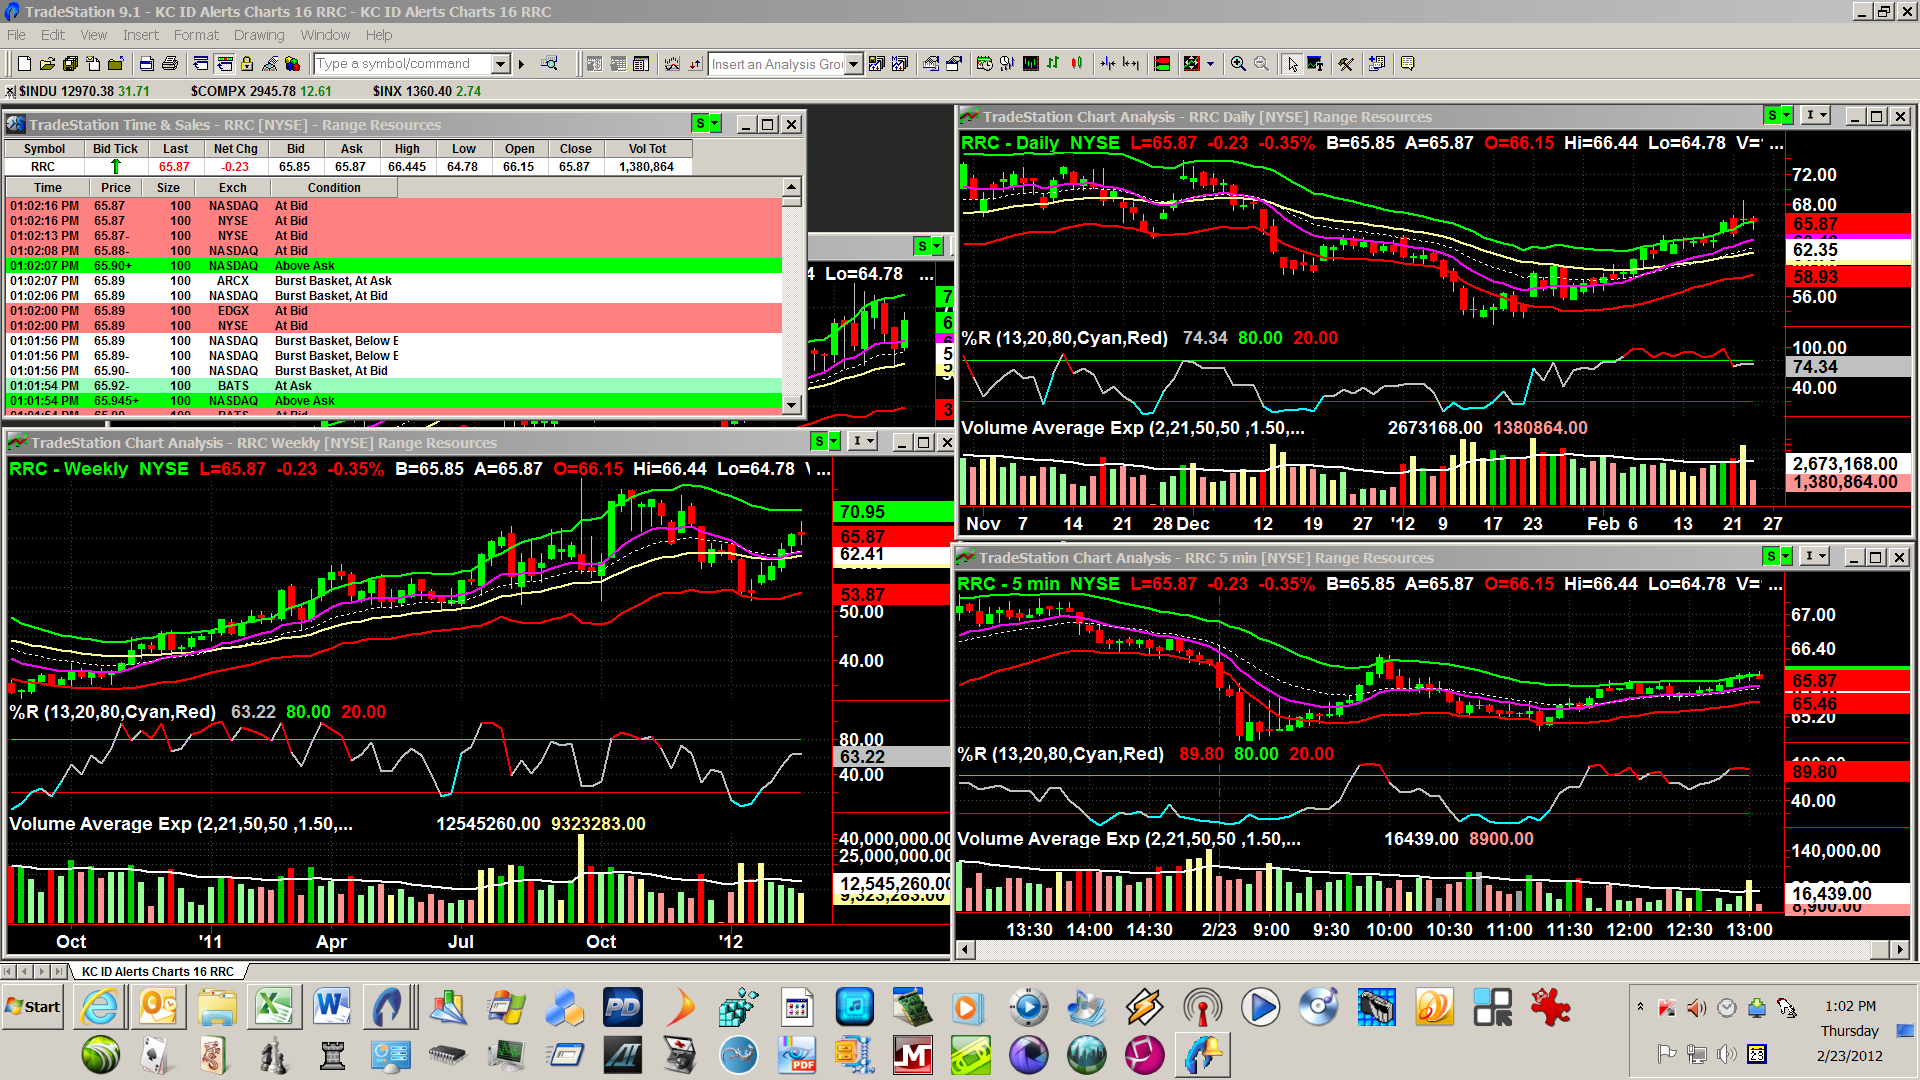
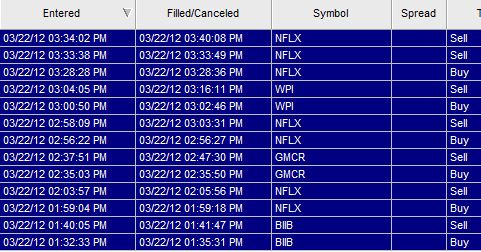
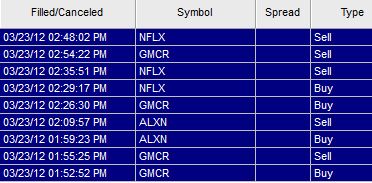
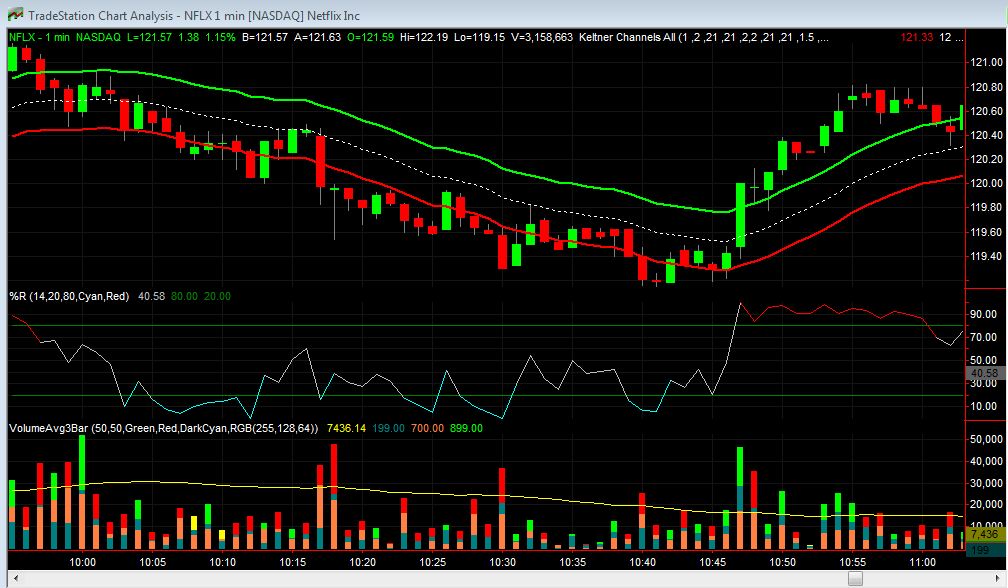
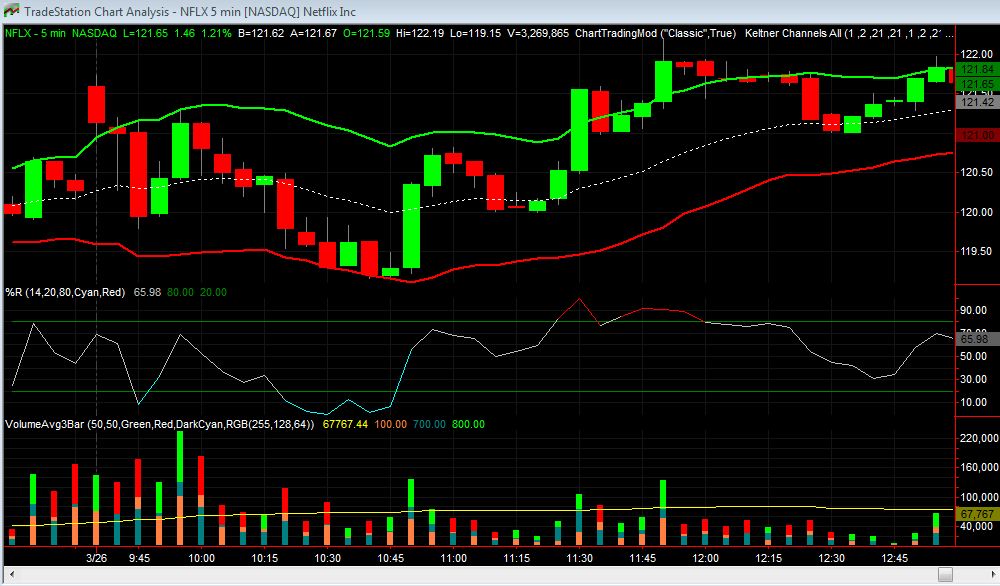
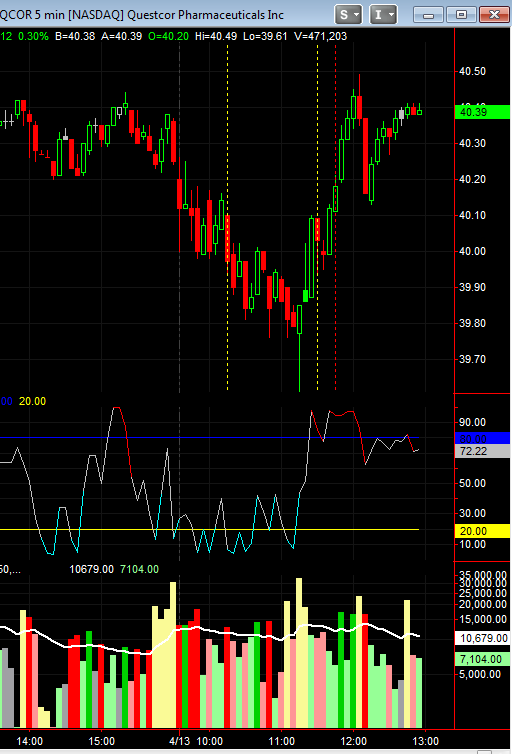
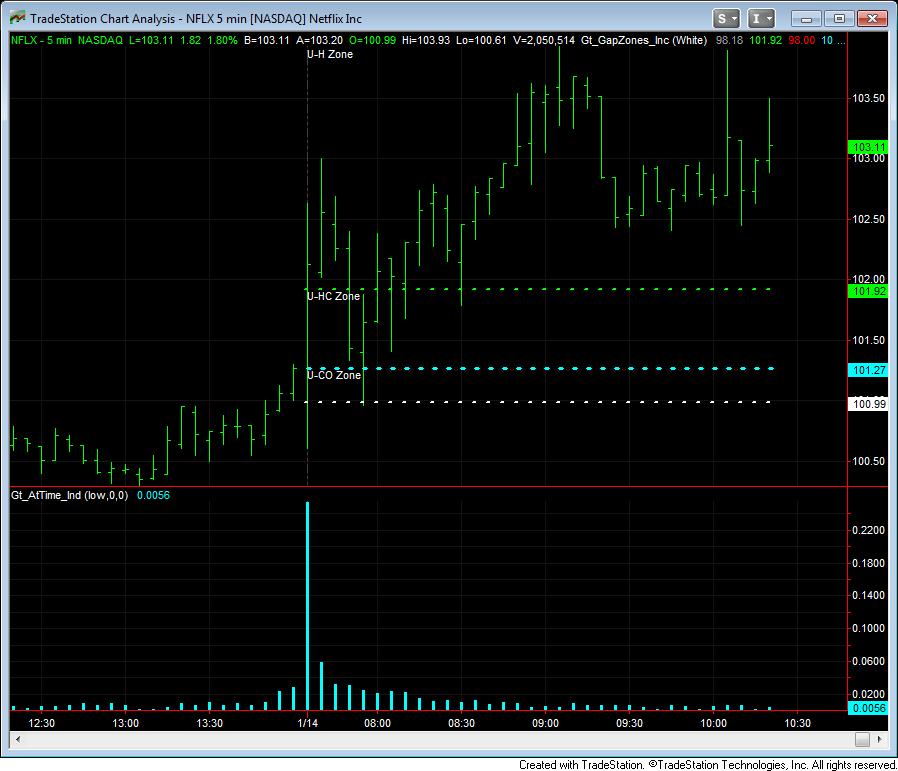
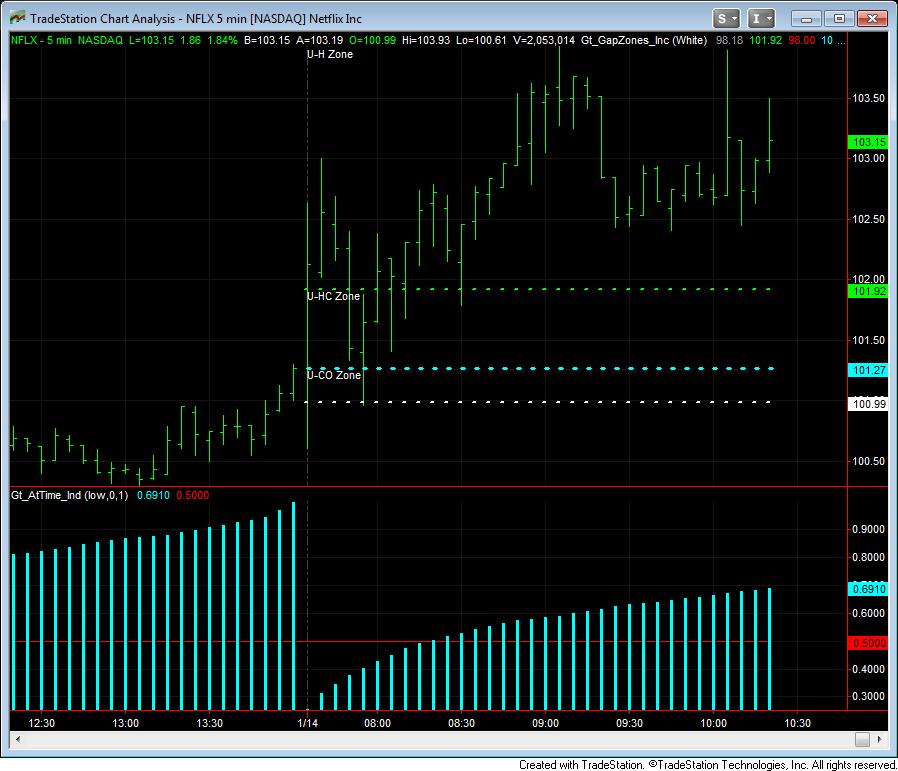
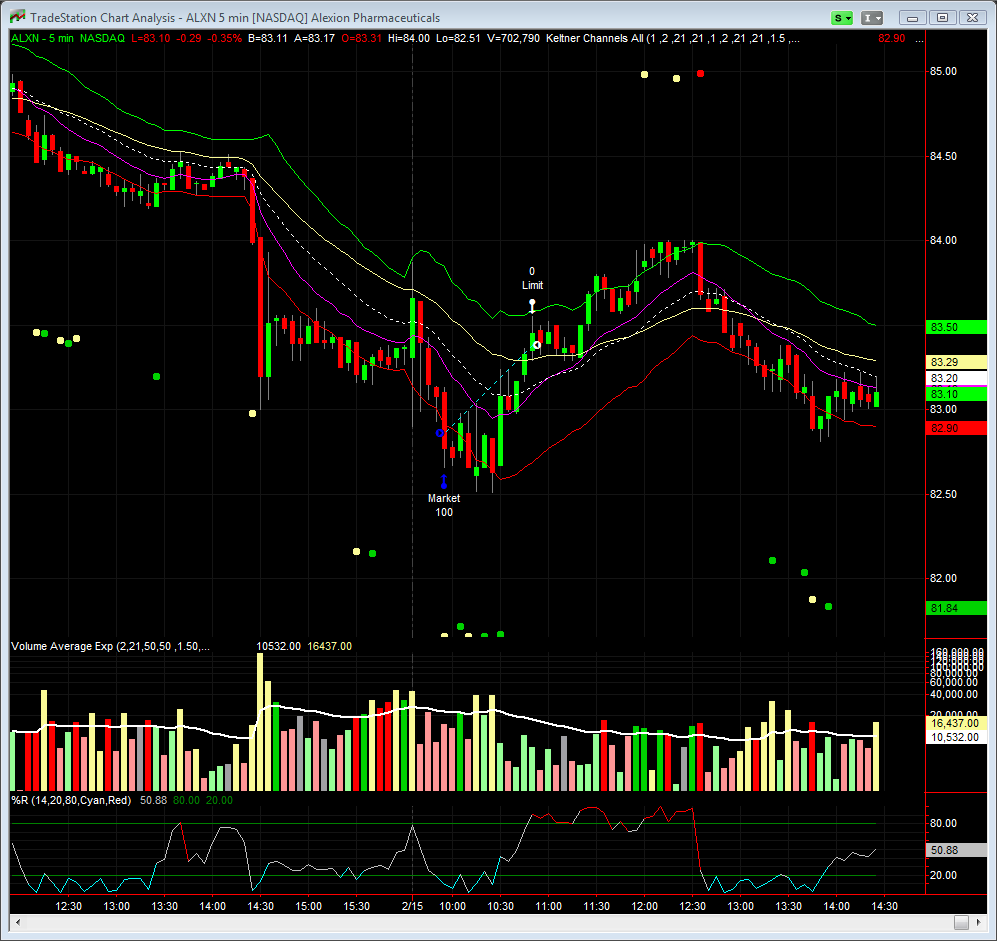
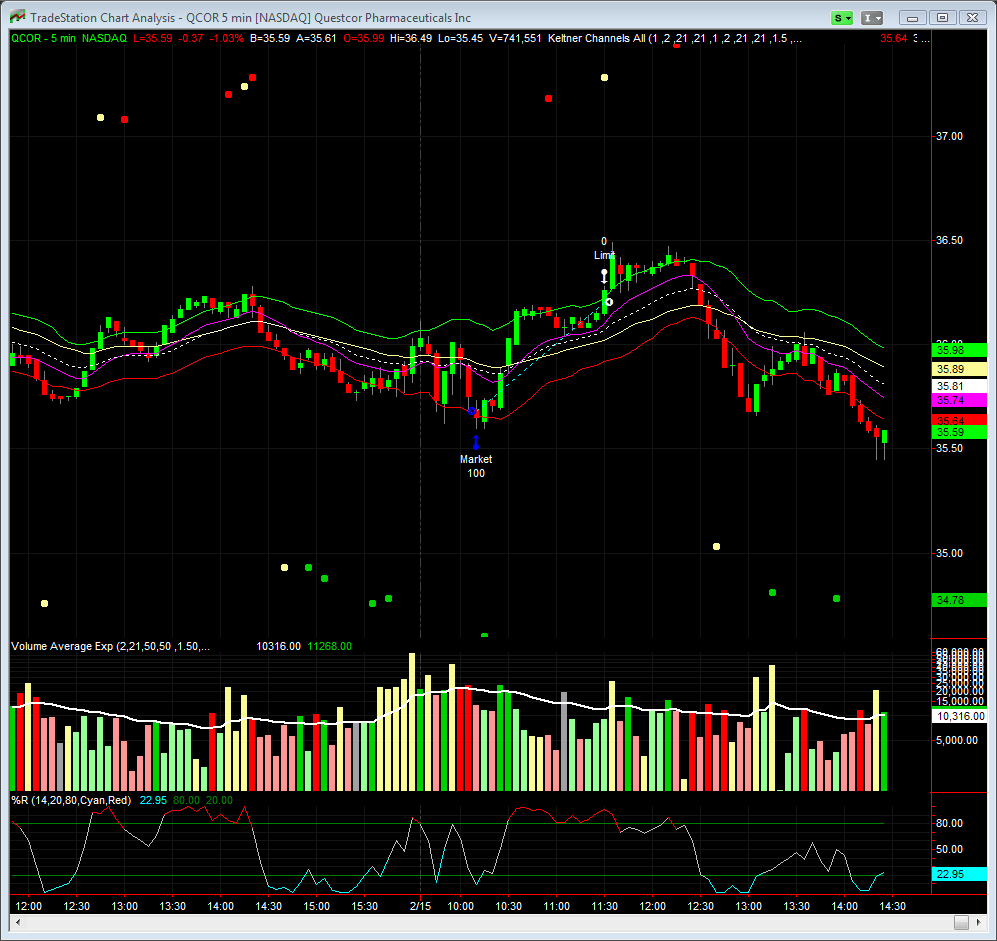
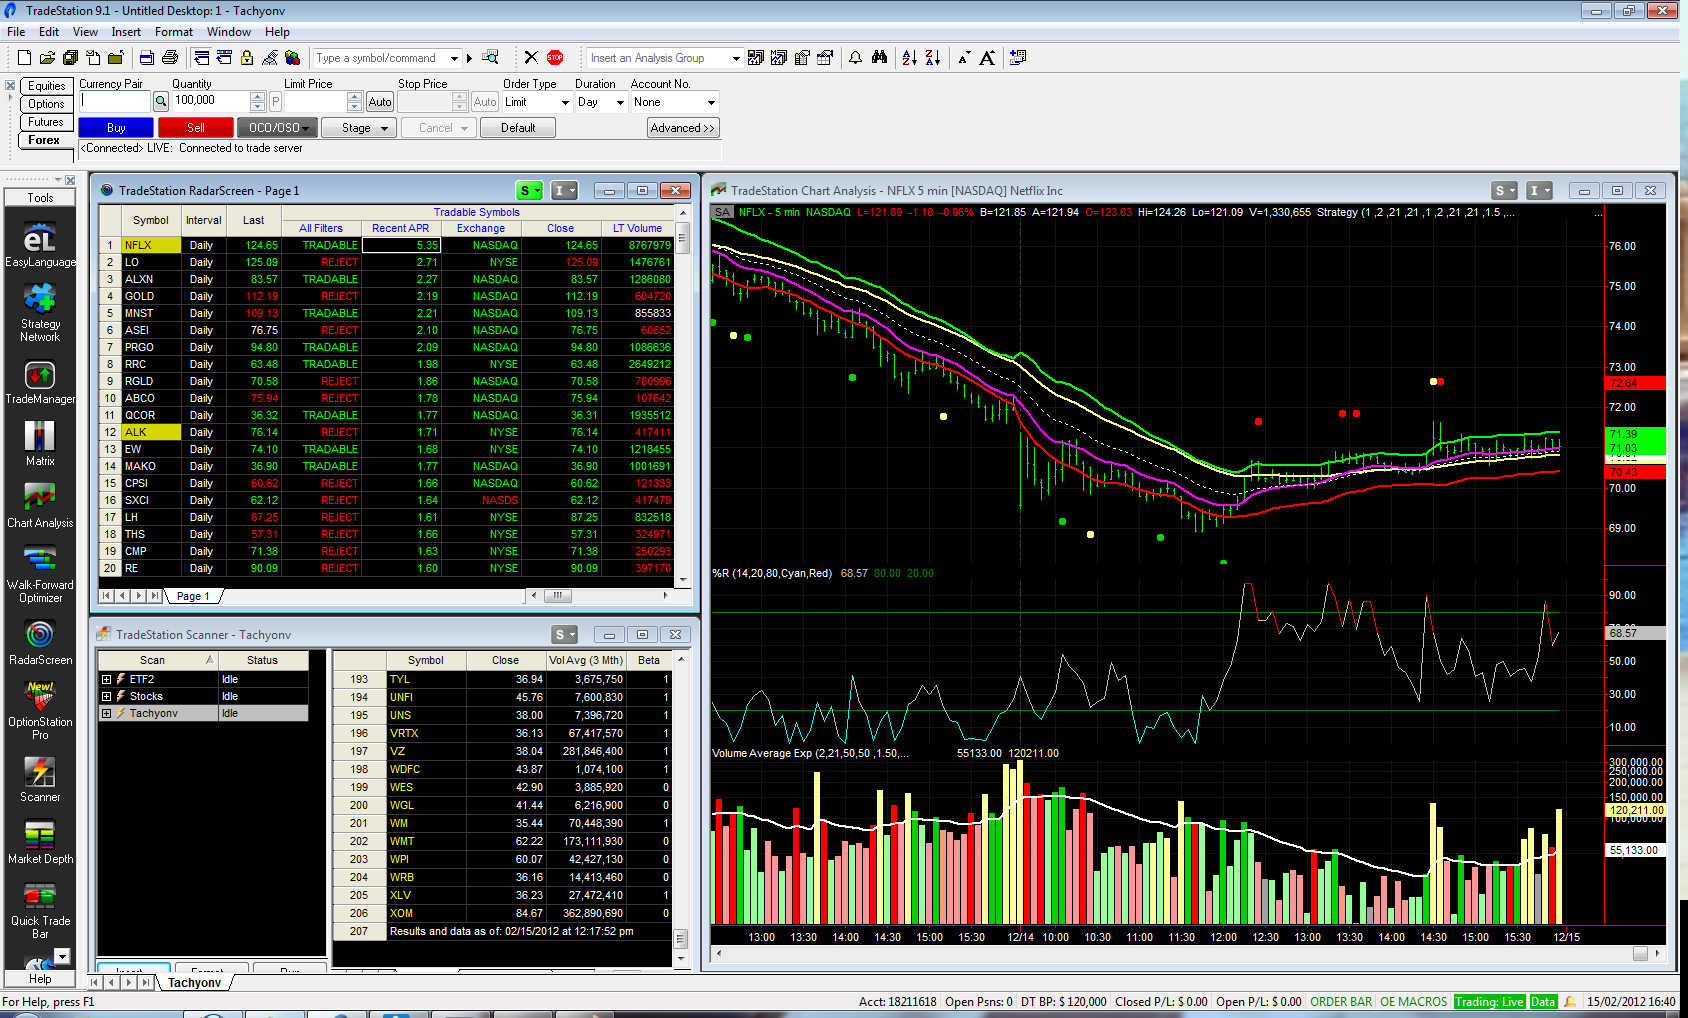
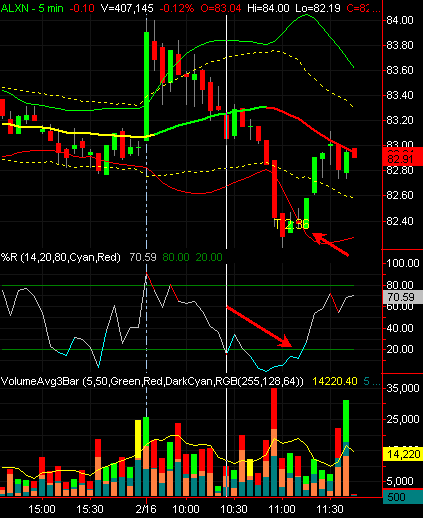
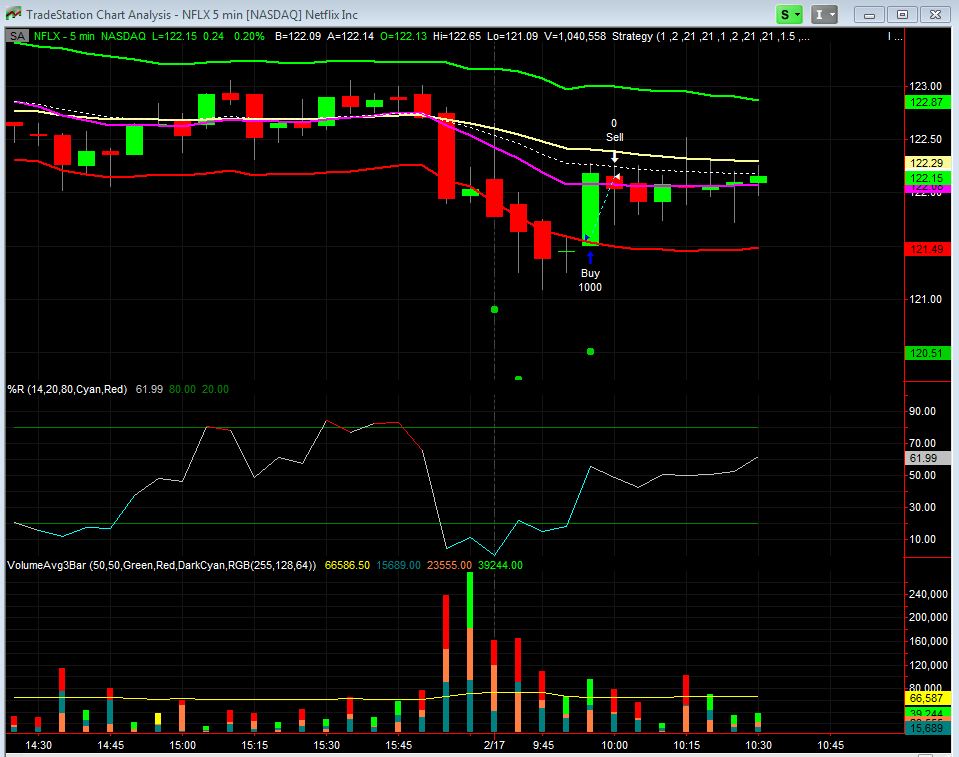
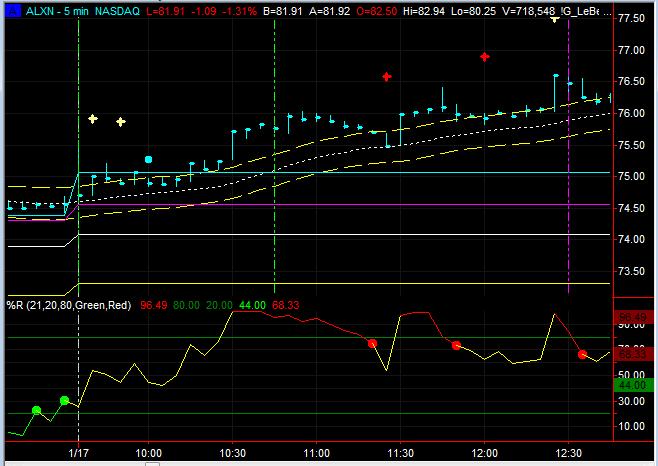
Created a .tsw per Tacyonv. Created a Scanner Scan per Tacyonv. Found ALXN, EW, LO, NFLX, PRGO, QCOR, RGLD, and RRC. Looked at each one before and at open; decided to trade NFLX based on lots of things that may be difficult to code, but could envision some indicator aids. Filled at 118.68 (Sim) in first 5 min bar. Exited at 119.20 in second 5 min bar. Left $ on the table, it's now trading above 120.45. Started off slow but in third 5 min bar and subsequent, rocketed. Agree with previous post regarding an auto stop. Goose's LeBeau Stops may be a starting point. ant___ p.s. NFLX trading above 121.00 now. |
|
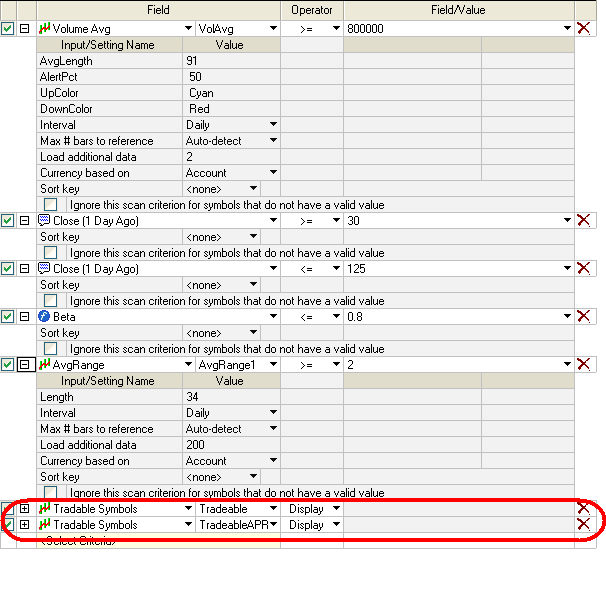
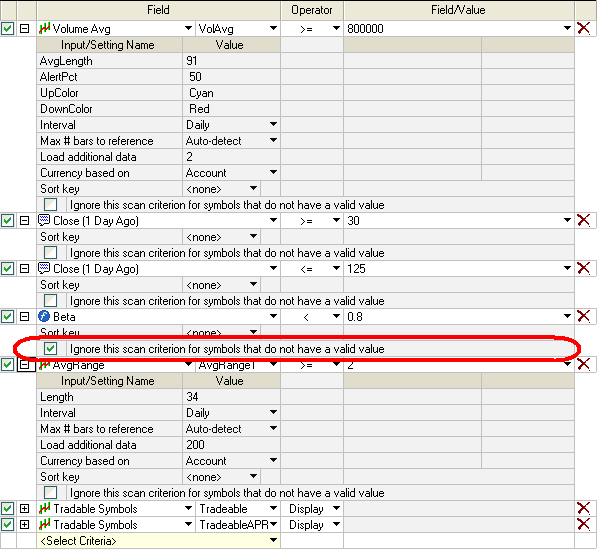
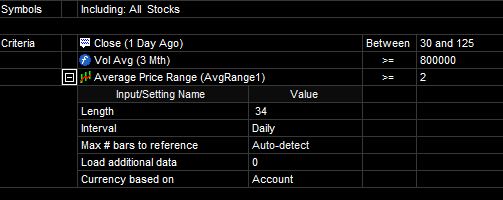
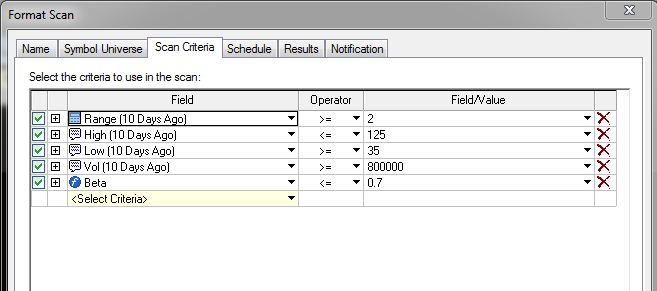
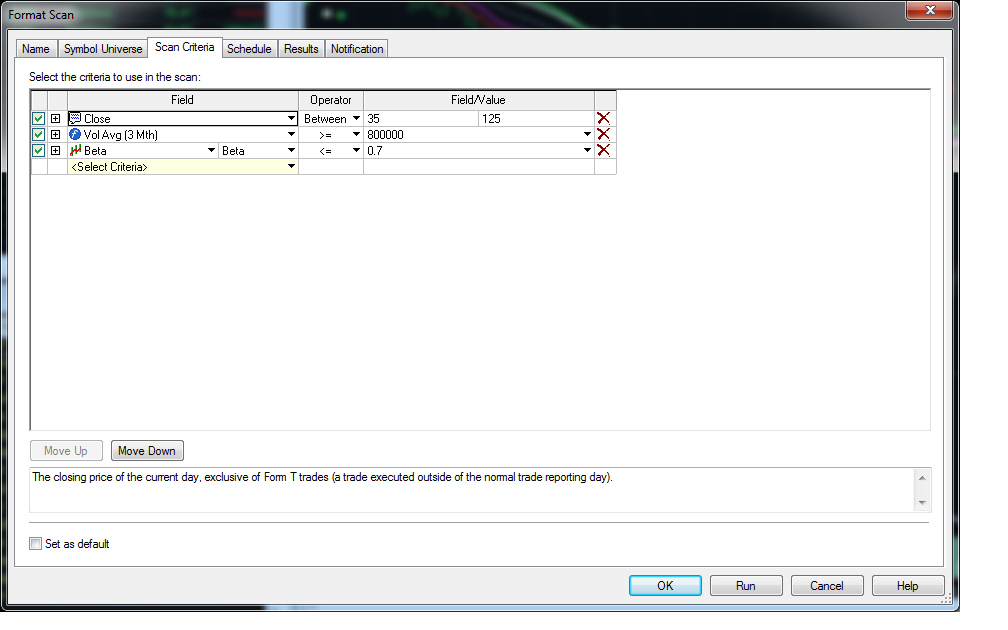
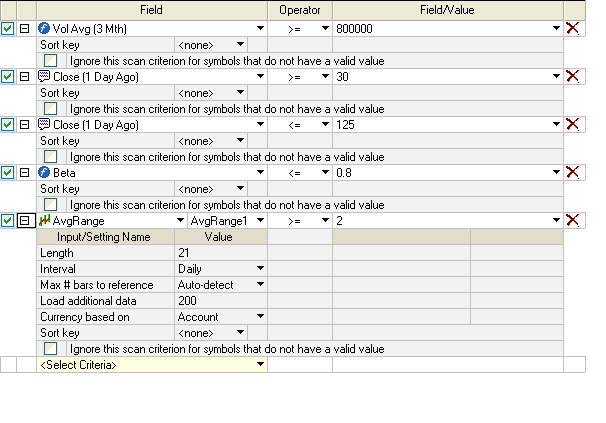
ant - Were those 8 the only ones that came up in a scan? I just ran the scan, and I have 38, but none of the ones you have. Maybe I am doing the scan wrong. This is what I have below. 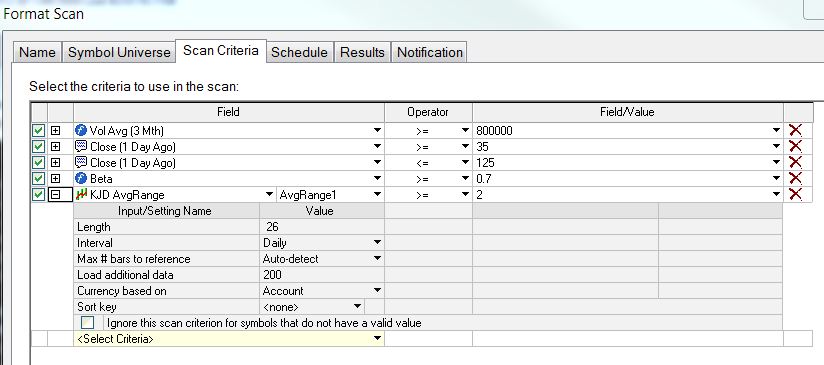
|
quote: kevinkdog, here's what I did (atch). Those 8 were the only ones that appeared. Attachment:DATA/20120214101338JW Screen 144.jpg 76662 bytes |
|
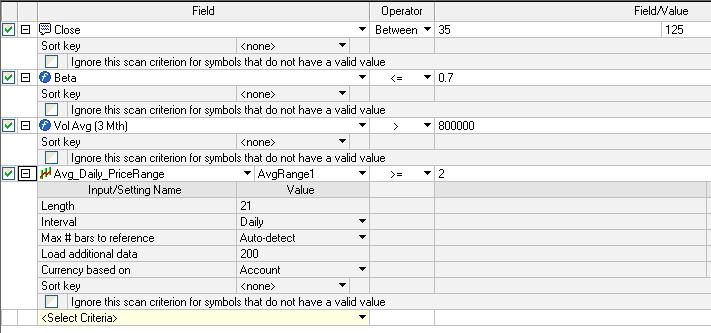
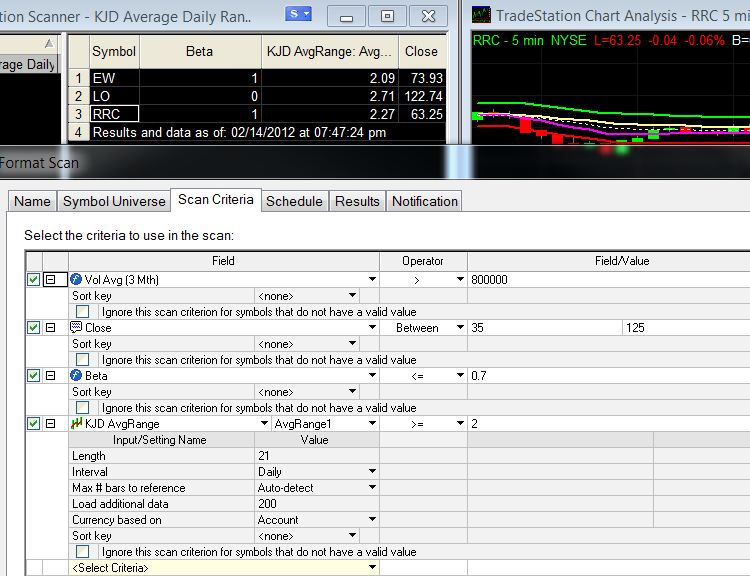
Ok Thanks, ant! I had beta wrong. And I'm using different volume
avg, and using Daily Range instead of ATR. I get LO and RRC now.
I'm guessing the diff is with ATR. I appreciate your help! |
|
Tachyonv, many thanks for sharing idea and your indicators. Glad that you are doing well in trading and hope that health serves you the same. ant, you are using ATR, while Tach specifically said to use daily range ( excludes gaps). I am not sure what KJD AveRange is, but that is probably one of the reasons why scans are different. Edit: kevin answered the same ... must have been typing at the same time |
quote: Happy to help. Thanks again for your previous generous assistance. |
quote: Right you are; thanks. |
quote: Scans are not the same Other difference is Beta >= 0.7(Kevin) versus Beta <= 0.70(_Ant) AveVol 10 days vs 3 months...etc TradingDude |
| Thanks TD! |
 17296
bytes
17296
bytes  14814
bytes
14814
bytes  17242
bytes
17242
bytes 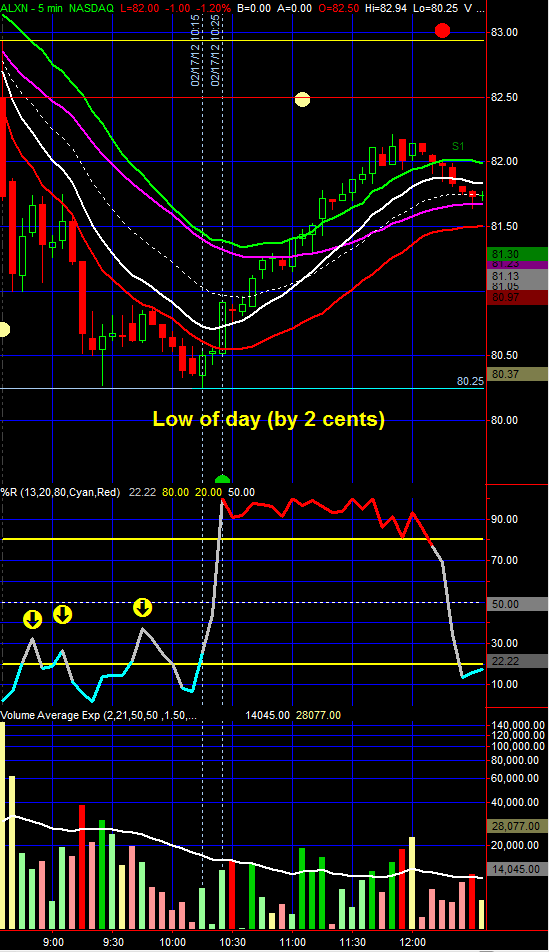
 13112
bytes
13112
bytes 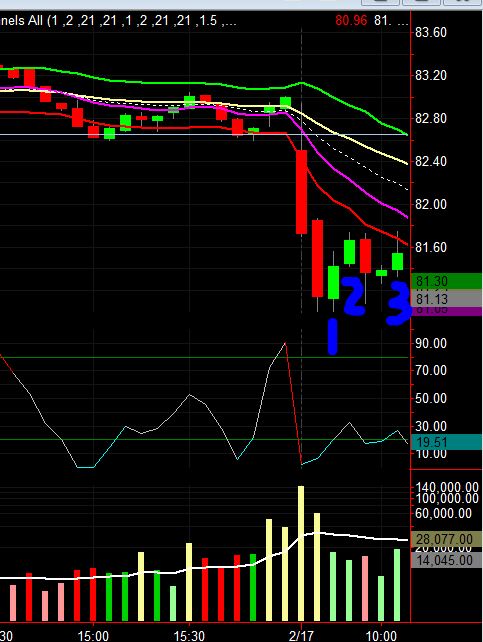
 31281
bytes
31281
bytes 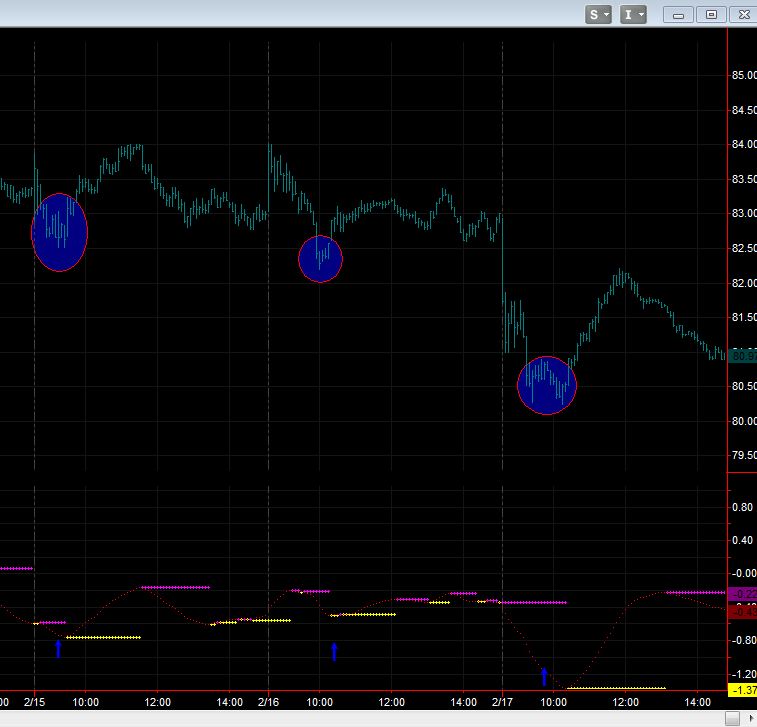
 43282
bytes
43282
bytes 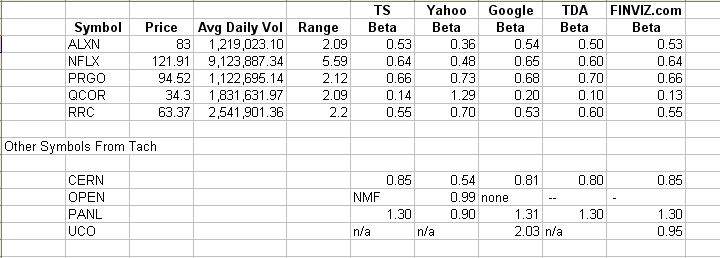 9815
bytes
9815
bytes 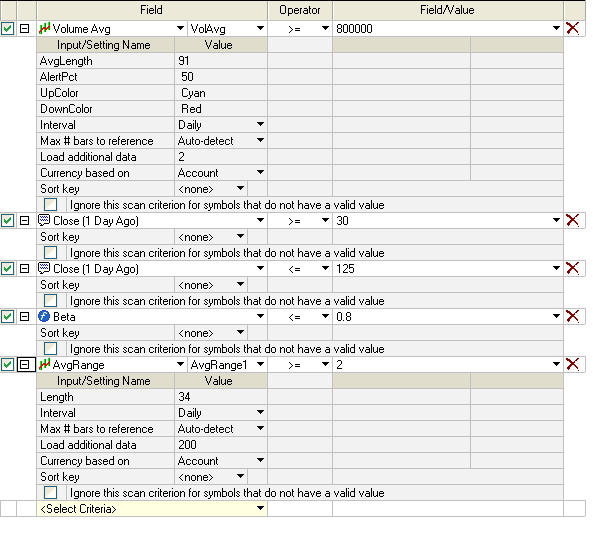 15957
bytes
15957
bytes