Don't even think about missing the next lesson. In that lesson you will receive your complimentary trading system as a thank you for your continued support.
There will be lots more systems and freebies along the way. It's just my way of saying thank you and to give something back to the trading community.
Learning to trade can be a lonely walk. One minute you can be as high as a kite and the next, you are ready to jump out the window
A friend of mine asked me the other day if I could teach him how to trade and would he make money at it? My answer was this. If I was an artist, I could teach you how to paint but I couldn't make you a Picasso. Only he has the ability to make himself a Picasso.
All the lessons you receive are part of the ''Traders Secret Library'' which you can access at http://www.tradingforbeginners.com
Remember every lesson you read is making you a more knowledgeable and effective trader.
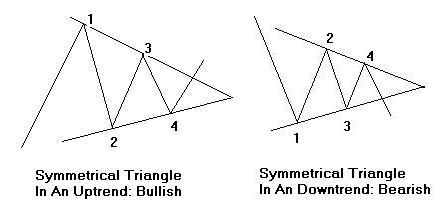
Symmetrical triangle patterns can be found in almost any market and any time
frame. They normally signify some indecision in the market and as the pattern
develops it is common to see a decrease in volume. The pattern forms as the
bar's highs and lows inside the triangle converge so as to outline the shape of
a triangle.
Symmetrical triangles have a tendency to break in the direction of the preceding trend and are often accompanied by heavy volume. Although this is often the case it is not a given and regardless of the direction of the break there are normally good opportunities to trade the breakout.
The fast way to tell if it's a bullish or bearish triangle is to find the
first point of contact farthest to the left inside the triangle (see chart
example). If the first point of the triangle is at the top left then it is a
bullish triangle. If the first
point in the triangle is in the bottom left then it is a bearish triangle.
To find a potential target of a triangle you can measure the base of the triangle and then add or subtract that from the breakout point. Lets assume that point 1 in our bullish triangle is 95 and point 2 in the triangle is 80. If you take 80 from 95 you get 15. Now lets assume the breakout point is 88. You add 15 to the breakout point to get 103. Therefore 103 is the target area for the breakout.
The same applies to the bearish triangle. If point 1 were 80 and point 2 were 95 you would still deduct 80 from 95 to get 15. If you get a breakout point of 85 you would now deduct 15 from 85 to get 70 as a potential target point.
In the example of the Japanese Yen (see second chart) point 1 was 111.71 and point 2 was 102.00 which gave us a base of 9.71. The breakout occurred at approximately 108.90. If we add 9.71 to 108.90 it gave us a target of 118.61.
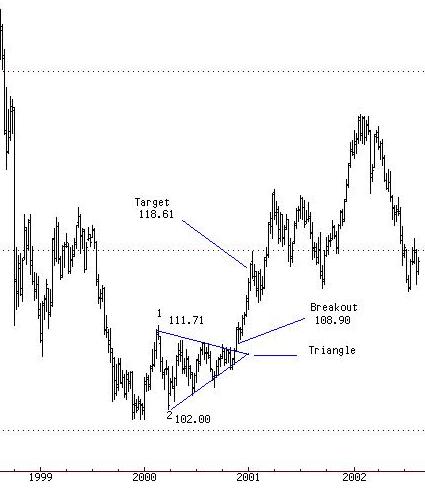
Although symmetrical triangle can often mean continuation of the trend this particular triangle (second chart) formed at the end of a downtrend and broke up.
Recommended Reading
Sure Fire Forex Trading (2004 Best seller)
How To Trade The Forex Market With A Secret Trading Formula Only a Handful Of Traders Know. 5 years of research to produce the most deadly accurate trading system ever. What you are about to read will change how you trade forever. Not only will it change how you trade - it will change how you look at the market. Here's why: There is a certain combination of simple indicators and technical analysis that can consistently and accurately tell you where to get into and out of the market with a massive profit and laser sharp accuracy. Learn More...