Relative Strength Index History
Relative Strength Index was developed by J.Welles Wilder Jr. and introduced in his book 'New Concepts In Technical Trading Systems'. It is one of the most popular technical tools around.
Relative strength Index (RSI) is measured on a scale from 0-100 with a reading above 70 being overbought and a reading below 30 being oversold. Originally he recommended a 14-day period as the setting but many other time periods have now become popular.
Wilder discusses 5 uses of RSI in his book.
Tops and Bottoms
These are indicated when the reading goes above 70 (top) and below 30 (bottom)
Chart Formations
The RSI may form chart formations that may or may not appear on the actual bar
chart e.g. you might see a head and shoulders formation on the RSI but not on
the bar chart.
Failure Swings
When the RSI goes above 70 or below 30 this is a strong indication that the
market is ready for a reversal.
Support and Resistance
It is sometimes more apparent that support or resistance is forming in the RSI
than can be seen on the bar chart.
Divergence
When price makes a new high or low and this is not confirmed by the RSI this
can be a very strong indication that a reversal is imminent.
My Use Of RSI
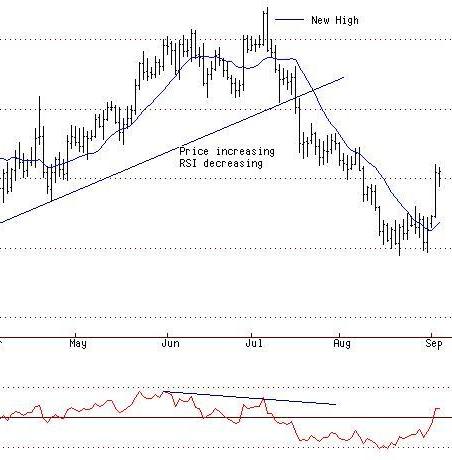
My own favorite use of RSI is that of divergence. When the
security you are trading makes a new high and the RSI turns down that is
bearish divergence.
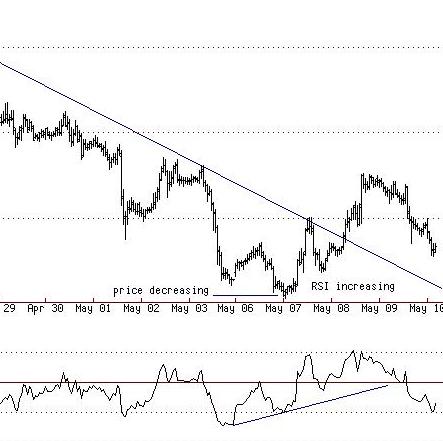
The same is true of bullish divergence. When price makes a new low and the RSI turns up that is bullish divergence.
I also prefer to see divergence at major tops and bottoms. That is to say, if we have been in an up trend for some time and I am already thinking this might be topping and I see divergence then I am a lot more confident that it has in fact topped and vice versa.
I don't like to use RSI as a sole trigger for a new position but rather I like to use it in combination with other indicators to help build a picture. You will notice that in most cases of divergence the security might make a high reflected on the RSI reading but then the RSI will start to decline as the security makes a another higher high. This is bearish divergence.
If the security makes a low and the RSI also makes a low but begins to turn up at the same time the security makes another lower low then that is bullish divergence.