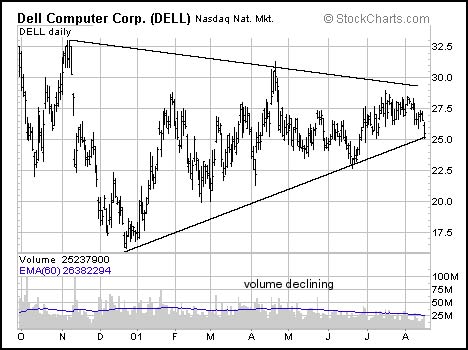
Importance of Volume


Price is Everything

Technical analysis is the study of historical price performance in an effort to predict future price performance. Price is the only accurate measure of investor sentiment -- it is the intersection of supply and demand. Investor sentiment is at least and possibly a more important determinant of price than fundamental factors like earnings, revenues and profit margins.

Technical analysis is the study of price and the factors that determine price and thus Fundamental analysis does play a role in shaping investors perception of value. The technical analyst believes that all perceptions of value are encapsulated in one statistic, price.

There are three important principles that govern all technical analysis. First, price is NOT random, second, price anticipates fundamental change and third, the relationship between price and time is linear.

Volume should follow the trend.

In a bullish phase volume should expand on rallies and contract on declines. In a bearish phase volume should expand on declines and contract on rallies.

In an uptrend an increasing number of buyers are required to thwart pent-up and natural selling pressures. The higher a stock moves in price the more likely it is that those that bought the stock at lower prices will want to sell. For the rally to continue these shares need to be absorbed by new buyers. If price advances quickly buyers may step back creating temporary weakness but these periods should be characterized by weak volume if the trend is strong.

In a bearish trend, when the outlook is poor, volume should expand on declines because buyers are overwhelmed by sellers. If the stock sinks quickly some sellers will refuse to sell, choosing to wait for a small rally in price. This temporary absence of sellers creates a small vacuum that should lead to a light volume rally. When the stock rallies sufficiently sellers that failed to exit ahead of the first major decline begin selling and once again volume should expand.

Volume should follow the trend. But what happens when a stock advances and volume contracts -- or a stock falters and volume expands? It is not supposed to happen but when it does the result is almost always a sharp reversal.


Rallies With Contracting Volume


Beware weak volume rallies amid good news

In the winter of 1999 data storage stocks were a momentum investors' dream. The news flow was positive and analysts were falling over one another to make a name for themselves by finding the next EMC Corp. (EMC). Atop the momentum mountain was Qlogic (QLGC).


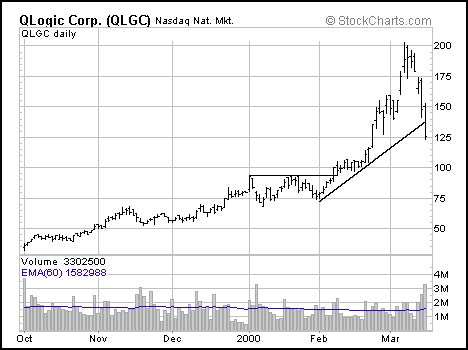
Qlogic had been mired in a consolidation pattern through early January and February 2000 before the stock had a volume breakout at $92. From that point the stock began a parabolic advance that saw the issue more than double in price in just one month! It was a momentum investors' dream come true -- there was just one problem, as the stock rallied to one new high after another amid buy recommendations and better than expected earnings reports, volume was slowing. In fact, all through the rally, volume did not approach the high made in early January when the initial consolidation began. When stocks rally to new highs amid slow or progressively weak volume technicians argue that they enter the distribution phase -- the phase where the "smart money" begins selling profitable long positions amid continued good news. By April 15, just another month later, the stock had fallen from better than $200 per share to just $60. The weak volume rally laid the foundation for a spectacular decline.

Declines With Expanding Volume


Be careful about selling into weak volume declines amid bad news

Now let's jump ahead one year. We are still looking at Qlogic but in the late winter of 2000 the data storage concern was a very different stock. Ravaged by an ongoing bear market for technology stocks and a steady stream of earnings warnings, Qlogic shares had fallen from favor with Wall Street analysts. Those that once forecast fundamental splendor now talked regularly of impending doom.


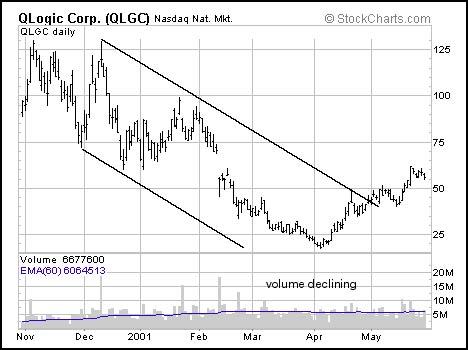
In the winter of 2000 Qlogic had fallen far from favor but the stock did begin the process of consolidating its losses during January 2001 and early February. The stock rallied from $60 to $98 during this time frame on better than average volume only to falter once again in the middle of February after an earnings warning from EMC Corp. (EMC). Qlogic, and most other data storage issues collapsed and by early April the stock had fallen to less than $20. It was a short sellers' dream -- there was just one problem, volume had contracted at each stage of the march to new lows. When stocks decline to new lows amid slow or progressively weak volume technicians argue that they enter the accumulation phase -- the phase where the smart money begins adding new positions for longer term gains. During the span of the next six weeks Qlogic shares had more than tripled on increased volume.

Large changes in price often occur after a decline in volume. A slowdown in volume (and narrowly defined trading range) is almost always the result of indecision on the part of investors. When they cannot come to consensus about fair value volume slows and the trading range narrows as most investors move to the sidelines and await further data. When there is sufficient data to come to a conclusion about future prospects volume expands and a large price move transpires. In most cases, technicians will call the slowdown in volume a consolidation.

On daily price charts consolidation patterns can last several days, several weeks or several months. They are most often rectangular in shape but the geometry is immaterial. The fact is that consolidation patterns are direct results of investor indecision and they are almost always followed by large price explosions.

Dell Computer (DELL): There was a time when Dell Computer was a must own stock for growth oriented money managers but all of this changed in the winter of 2000 when some investors began to doubt that computer markers could turn-in good profits in the face of slowing demand and rising competition from handheld and other devices.


In November of 2000 Dell Computer began a decline that would see the stock ultimately almost cut in half over the course of just seven weeks. The stock peaked at $33 and sank to a mere $16.75 in late December. At the time very few investors probably understood that the stock would remain mired in this trading range for most of the next year. In fact, Dell Computer became entangled in a triangular trading range (wedge) that saw prices narrow and trading volume collapse as investors tried to make sense of the outlook for computer hardware in a slowing economy and the aftermath of the technology bubble. By the middle of April 2001 Dell Computer had rallied to $31 only to falter once again to $22.60 in the middle of June. During this entire consolidation period trading volume slowed progressively.

Price consolidation is a necessary stage for all stocks. The period that follows consolidation is breakout and this can be the most exciting phase for any stock.

In its purest form, a breakout is the period immediately following a consolidation. It is that point in time where consensus is reached and those that were on one side of the market are overwhelmed by those investors on the other side. For that small moment in time investors agree on price direction.

Most traders say that stocks are mired in some form of consolidation pattern fully 70-percent of the time. The other 30-percent brings dramatic price breakouts -- both up and down. Obviously traders are looking for breakouts because it is during this period that the majority of successful (predictable) trades occur.

Upside Breakouts


Consider this upside breakout for Dial Corp. (DL). For several months the soap maker was largely ignored by both traders and investors alike because fundamental prospects were thought to be less than exciting. The company was a steady, if not spectacularly slow grower but there was no immediate reason to buy or sell the stocks.

Dell Computer (DELL): There was a time when Dell Computer was a must own stock for growth oriented money managers but all of this changed in the winter of 2000 when some investors began to doubt that computer markers could turn-in good profits in the face of slowing demand and rising competition from handheld and other devices.


By now you should recognize the pattern created by the price action for Dial Corp. (DL). It is the dreaded wedge. These longer-term patterns are characterized by dramatic declines in both volatility (trading range) and volume. That was certainly true of Dial Corp. from late December 2000 through the middle of July 2001. After hitting a low at $10.10 in the middle of December the stock surged to $15.50 in mid-January, fell back to $12 in the middle of March through late April, rallied toward $15.25 in early June, only to fall back to $13.50 in the middle of July. In late July Dial Corp. began to rally toward $15 on increased volume. Several sessions later volume increased dramatically and the stock had a breakout to a relative new high. Note that both volume and volatility contracted dramatically during the consolidation phase and exploded as the upside breakout occurred.

Understanding the importance of volume in an upside breakout is fairly simple, volume must expand on the breakout if the move is to be considered valid. Volume and downside breakouts are more complex.

This is because volume is not necessarily required. This makes sense because unlike rallies where increased volume is needed to absorb normal selling pressures, in a decline stockholders become demoralized and that emotion leads to inactivity. Yes, there will be downside breakouts that are characterized by dramatic surges in volume but these events will always be at the end of the move lower as stockholders capitulate. This makes sense because the longer the decline proceeds the more volume becomes the ally of buyers, not sellers. Indeed, as mentioned in our previous sections, traders need to be wary of increased volume after a longer-term decline because very often it

Downside Breakouts


Let's consider the downside breakout of natural gas distributor Enron (ENE). Once considered a broadband play because of its foray into the Internet infrastructure business, Enron fell on hard times in February of 2001. Indeed, during the span of just seven months the stock had two noteworthy downside breakouts.


During December 2000 through the early part of March 2001 Enron was mired in a large wedge formation. The stock had lows at $65, $66 and $67.50 in December, January and March respectively. The top part of the wedge was defined by highs at $83.50, $82.50 and $81.75 in December, January and February respectively. The downside breakout occurred in early March at $67.50 amid very subdued volume. Despite this the stock sank to $52 in less than two weeks and it was not until volume increased that the decline subsided. The second wedge began with the $52 low in the middle of March. After several tests of that support level, Enron shares fell through $52 in the early part of June. Once again, volume was relatively light but this downside breakout ultimately led to a decline that would see the Enron shares sink to less than $35 just a week later.

Conclusion
 

  • Generally, volume follows trend, that is in a rising trend volume should expand on rallies and contract on declines. In falling trends volume should expand on declines and contract on rallies.
  • When volume contracts after an extended rally, or expands sharply after an extended decline a dramatic reversal will normally transpire.
  • Volume and volatility contract in consolidation patterns because investors cannot reach consensus, they are undecided.
  • Volume should expand significantly for upside breakouts. If volume does not expand the breakout is considered illegitimate.
  • Volume may not expand for a downside breakout because falling share prices cause demoralization and inactivity among stockholders. During such circumstances, fewer shares are required to drive prices lower.