Elliott Wave Theory Introduction

R. N. Elliott believed markets had well-defined waves that could be used to predict market direction. In 1939, Elliott detailed the Elliott Wave Theory, which states that stock prices are governed by cycles founded upon the Fibonacci series (1-2-3-5-8-13-21...).


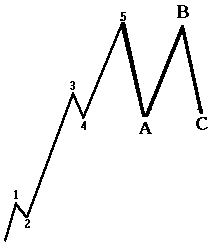
According to the Elliott Wave Theory, stock prices tend to move in a predetermined number of waves consistent with the Fibonacci series. Specifically, Elliott believed the market moved in five distinct waves on the upside and three distinct on the downside:

Elliot Wave

Waves one, three and five represent the 'impulse', or minor upwaves in a major bull move. Waves two and four represent the 'corrective,' or minor downwaves in the major bull move. The waves lettered A and C represents the minor downwaves in a major bear move, while B represents the one upwave in a minor bear wave.


Elliott proposed that the waves existed at many levels, meaning there could be waves within waves. To clarify, this means that the chart above not only represents the primary wave pattern, but it could also represent what occurs just between points 2 and 4. The diagram below shows how primary waves could be broken down into smaller waves.

Elliot Wave


Elliott Wave theory ascribes names to the waves in order of descending size:

    1. Grand Supercycle
    2. Supercycle
    3. Cycle
    4. Primary
    5. Intermediate
    6. Minor
    7. Minute
    8. Minuette
    9. Sub-Minuette

The major waves determine the major trend of the market, and minor waves determine minor trends. This is similar to the manner in which Dow Theory postulates primary and secondary trends. Elliott provided numerous variations on the main wave, and placed particular importance on the golden mean, 0.618, as a significant percentage for retracement.

Trading using Elliott Wave patterns is quite simple. The trader identifies the main wave or supercycle, enters long, and then sells or shorts, as the reversal is determined. This continues in progressively shorter cycles until the cycle completes and the main wave resurfaces. The caution to this is that much of the wave identification is taken in hindsight and disagreements arise between Elliott Wave technicians as to which cycle the market is in.

Elliott Wave Theory Analysis for Trading

About Elliott Wave Theory
The Elliott Wave Theory is named after Ralph Nelson Elliott. Inspired by the Dow Theory and by observations found throughout nature, Elliott concluded that the movement of the stock market could be predicted by observing and identifying a repetitive pattern of waves. In fact, Elliott believed that all of man's activities, not just the stock market, were influenced by these identifiable series of waves.

Elliott based part his work on the Dow Theory, which also defines price movement in terms of waves, but Elliott discovered the fractal nature of market action. Thus Elliott was able to analyze markets in greater depth, identifying the specific characteristics of wave patterns and making detailed market predictions based on the patterns he had identified.

Definition of Elliott Waves
In the 1930s, Ralph Nelson Elliott found that the markets exhibited certain repeated patterns. His primary research was with stock market data for the Dow Jones Industrial Average. This research identified patterns or waves that recur in the markets. Very simply, in the direction of the trend, expect five waves. Any corrections against the trend are in three waves. Three wave corrections are lettered as "a, b, c." These patterns can be seen in long-term as well as in short-term charts. Ideally, smaller patterns can be identified within bigger patterns. In this sense, Elliott Waves are like a piece of broccoli, where the smaller piece, if broken off from the bigger piece, does, in fact, look like the big piece. This information (about smaller patterns fitting into bigger patterns), coupled with the Fibonacci relationships between the waves, offers the trader a level of anticipation and/or prediction when searching for and identifying trading opportunities with solid reward/risk ratios.

There have been many theories about the origin and the meaning of the patterns that Elliott discovered, including human behavior and harmony in nature. These rules, though, as applied to technical analysis of the markets (stocks, commodities, futures, etc.), can be very useful regardless of their meaning and origin.

Simplifying Elliott Wave Analysis
Elliott Wave analysis is a collection of complex techniques. Approximately 60 percent of these techniques are clear and easy to use. The other 40 are difficult to identify, especially for the beginner. The practical and conservative approach is to use the 60 percent that are clear.

When the analysis is not clear, why not find another market conforming to an Elliott Wave pattern that is easier to identify?

From years of fighting this battle, we have come up with the following practical approach to using Elliott Wave principles in trading.

The whole theory of Elliott Wave can be classified into two parts:

Impulse patterns
Corrective patterns

Elliott Wave Basics — Impulse Patterns
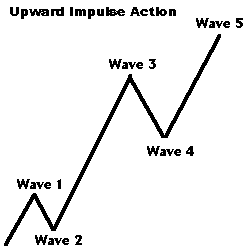
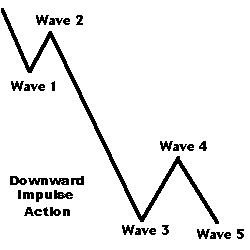
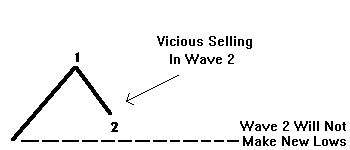
The impulse pattern consists of five waves. The five waves can be in either direction, up or down. Some examples are shown to the right and below.upward impulse actionThe first wave is usually a weak rally with only a small percentage of the traders participating. Once Wave 1 is over, they sell the market on Wave 2. The sell-off in Wave 2 is very vicious. Wave 2 will finally end without making new lows and the market will start to turn around for another rally.


downward impulse action


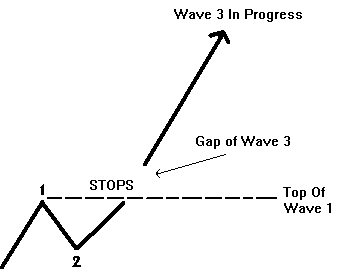
The initial stages of the Wave 3 rally are slow, and it finally makes it to the top of the previous rally (the top of Wave 1).
 

At this time, there are a lot of stops above the top of Wave 1.


vicious selling in wave 2

Traders are not convinced of the upward trend and are using this rally to add more shorts. For their analysis to be correct, the market should not take the top of the previous rally.
 

Therefore, many stops are placed above the top of Wave 1.
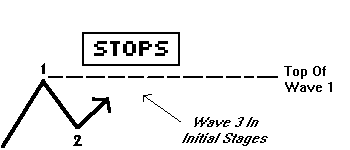
wave 3 initial stages


wave 3 in progressThe Wave 3 rally picks up steam and takes the top of Wave 1. As soon as the Wave 1 high is exceeded, the stops are taken out. Depending on the number of stops, gaps are left open. Gaps are a good indication of a Wave 3 in progress. After taking the stops out, the Wave 3 rally has caught the attention of traders.
 

The next sequence of events are as follows: Traders who were initially long from the bottom finally have something to cheer about. They might even decide to add positions.
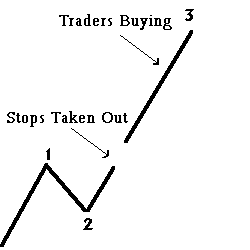
 

traders buyingThe traders who were stopped out (after being upset for a while) decide the trend is up, and they decide to buy into the rally. All this sudden interest fuels the Wave 3 rally.
 

This is the time when the majority of the traders have decided that the trend is up.
 

Finally, all the buying frenzy dies down; Wave 3 comes to a halt.
 

Profit taking now begins to set in. Traders who were long from the lows decide to take profits. They have a good trade and start to protect profits.This causes a pullback in the prices that is called Wave 4.
 

Wave 2 was a vicious sell-off; Wave 4 is an orderly profit-taking decline.
 

While profit-taking is in progress, the majority of traders are still convinced the trend is up. They were either late in getting in on this rally, or they have been on the sideline.
 

They consider this profit-taking decline an excellent place to buy in and get even.
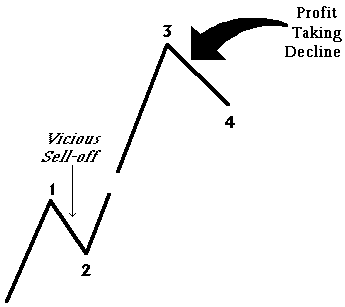
profit taking decline
 

On the end of Wave 4, more buying sets in and the prices start to rally again.
 

The Wave 5 rally lacks the huge enthusiasm and strength found in the Wave 3 rally. The Wave 5 advance is caused by a small group of traders.
 

Although the prices make a new high above the top of Wave 3, the rate of power, or strength, inside the Wave 5 advance is very small when compared to the Wave 3 advance.
 

Finally, when this lackluster buying interest dies out, the market tops out and enters a new phase.


Elliott Wave Basics — Corrective Patterns
Corrections are very hard to master. Most Elliott traders make money during an impulse pattern and then lose it back during the corrective phase.
 

An impulse pattern consists of five waves. With the exception of the triangle, corrective patterns consist of 3 waves. An impulse pattern is always followed by a corrective pattern. Corrective patterns can be grouped into two different categories:

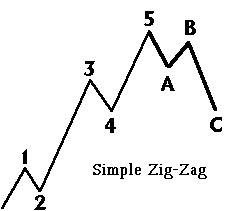
Simple Correction (Zig-Zag)
Complex Corrections (Flat, Irregular, Triangle)

Simple Correction (Zig-Zag)
simple zig-zagThere is only one pattern in a simple correction. This pattern is called a Zig-Zag correction. A Zig-Zag correction is a three-wave pattern where the Wave B does not retrace more than 75 percent of Wave A. Wave C will make new lows below the end of Wave A. The Wave A of a Zig-Zag correction always has a five-wave pattern. In the other two types of corrections (Flat and Irregular), Wave A has a three-wave pattern. Thus, if you can identify a five-wave pattern inside Wave A of any correction, you can then expect the correction to turn out as a Zig-Zag formation.
 

Fibonacci Ratios inside a Zig-Zag Correction
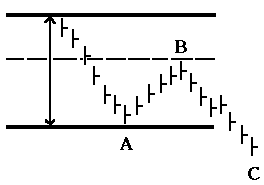
fibonacci ratios in a zig-zag correction

Wave B
Usually 50% of Wave A
Should not exceed 75% of Wave A
Wave C
either 1 x Wave A
or 1.62 x Wave A
or 2.62 x Wave A


A simple correction is commonly called a Zig-Zag correction.
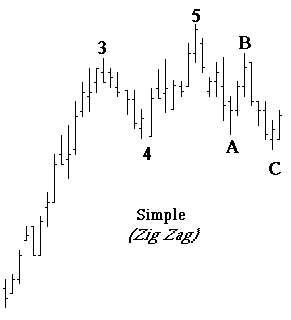
simple zig-zag

Complex Corrections (Flat, Irregular, Triangle)
The complex correction group consists of 3 patterns:

Flat
Irregular
Triangle

Flat Correction
In a Flat correction, the length of each wave is identical. After a five-wave impulse pattern, the market drops in Wave A. It then rallies in a Wave B to the previous high. Finally, the market drops one last time in Wave C to the previous Wave A low.
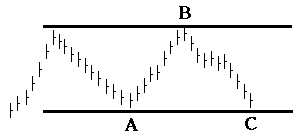
flat correction 1

flat correction 2

flat correction 3
 

Irregular Correction
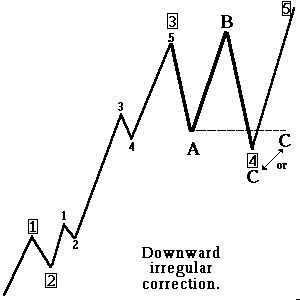
In this type of correction, Wave B makes a new high. The final Wave C may drop to the beginning of Wave A, or below it.
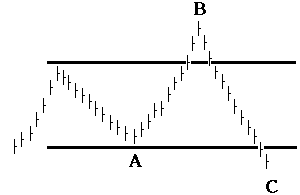
irregular correction

downward irregular correction
 

Fibonacci Ratios in
an Irregular Wave
Wave B = either 1.15 x
Wave A or 1.25 x Wave A
Wave C = either 1.62 x
Wave A or 2.62 x Wave A

Triangle Correction
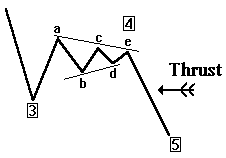
In addition to the three-wave correction patterns, there is another pattern that appears time and time again. It is called the Triangle pattern. Unlike other triangle studies, the Elliott Wave Triangle approach designates five sub-waves of a triangle as A, B, C, D and E in sequence.
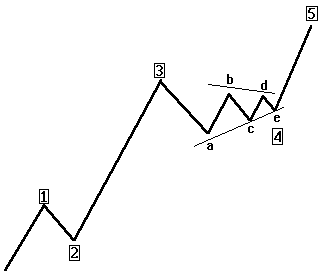
triangle correction
 

downward thurstTriangles, by far, most commonly occur as fourth waves. One can sometimes see a triangle as the Wave B of a three-wave correction. Triangles are very tricky and confusing. One must study the pattern very carefully prior to taking action. Prices tend to shoot out of the triangle formation in a swift thrust.
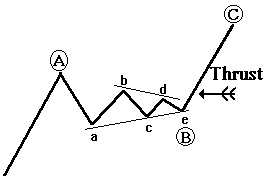
 

upward thurstWhen triangles occur in the fourth wave, the market thrusts out of the triangle in the same direction as Wave 3. When triangles occur in Wave Bs, the market thrusts out of the triangle in the same direction as the Wave A.


Alteration Rule
If Wave Two is a simple correction, expect
Wave Four to be a complex correction.
If Wave Two is a complex correction,
expect Wave Four to be a simple correction.

Elliott Wave Theory - FRACTALS

One of the basic tenets of Elliott Wave theory is that market structure is fractal in character. The non-scientific explanation is that Elliott Wave patterns that show up on long term charts will also show up on lower time frame charts, albeit with more complex structures. We are not aware of any peer review quality research to support or disprove this hypothesis, but it does appear credible from the empirical evidence of others and from our own experience. This property is called "self-similarity" and it is what a writer is referring to when he says that the market is fractal in nature.

Our use of the word fractal, or Elliott Wave fractal, is not a use of the property of self-similarity. When we use the term we mean a "counting fractal," which is really a description of a particular bar on a high-low bar chart. We do this not to create confusion but to give proper credit to Dr. Bill Williams, the originator of the expression as we use it.

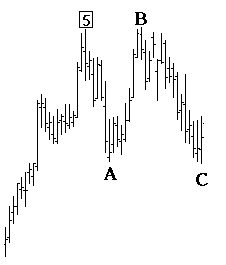
Using so called fractals to count Elliott Waves first appeared, to our knowledge, in Dr. Bill Williams' book "Trading Chaos." Like many other concepts in Dr. Willams' books, the fractal is elegant in its simplicity. The basic definition of an 'up' fractal is a bar high that is both higher than the two bars immediately preceding it, and higher than the two bars immediately following it. The lows of the bars are not considered in determining the up fractal progression.

If two bars in the progression have equal highs followed by two consecutive bars with lower highs, then a total of six bars rather than the usual five bars will make up the progression. The first high becomes the counting fractal. Reverse for 'down' fractals.

A wide range bar can be both an 'up' fractal and a 'down' fractal at the same time.

Using fractals to count Elliott Waves is a breakthrough because any particular bar either is a fractal or it is not a fractal. There are no half-pregnant fractals. You will especially appreciate this if you have ever tried counting waves from a close only line chart.

In a perfect world every time frame chart would have unambiguous sequences of up and down fractals to mark every Elliott Wave. Unfortunately, that's not the case. Quite often the fractal progression is broken with what we call 'fugitive' fractals, for example, two clearly marked up fractals with no intervening down fractal to unambiguously complete the wave. In these cases you have to use your own judgment and go lower or higher in time frames, or use a close only chart to resolve the relative importance of the fugitive fractal and whether or not it should be "forced" into the wave count.

Fractals mark the beginning and ending points of individual waves. As Dr. Williams put it, "Whatever happens between fractals is an Elliott Wave."
 

Elliott Wave Theory - TRADING SIGNALS

Conventional wisdom says that you cannot predict tops and bottoms. That may or may not be true. The good news is that you don't have to predict tops and bottoms to be successful, you only have to identify one as a high probability event after it's already happened.

When do you enter the trade? How do you determine reasonable stop-loss levels for the trade? The table describes the objectively determined trading signals that appear on the subscribers' intraday pages. Which signal you decide to follow is up to you. Each trader is an individual with a different risk tolerance level and decision-making process. The trading signals are not investment advice. This is a blue collar site – not a guru site. We publish the results of a fairly impressive set of tools that can be duplicated only with thousands of dollars and hundreds of hours or time. How you choose to use them is up to you. The list of objective signals, and their trading implications, is a good basis from which to complete your trading plan.

SIGNAL

CONDITIONS

IMPLICATIONS

Reversal Alert (RA)

A coincidence of Pattern, Price and Time has come together to mark a major pivot that we have identified as the 5th of a 5th wave, or a large degree Wave B. The Elliott Wave pattern may not always be the one that we were expecting. When a fractal occurs it means that a wave has ended, ready or not.

 The suspected high or low tick at a major pivot point is the ideal entry point. This entry has the least capital risk because it is closest to the initial stop loss point - the pivot. The trade off is that there will be a higher percentage of losses. The market does not always reverse where we want it to! The pivot point is Wave Zero.

Wave 1 Alert (W1A)

Wave 1 is the first swing in the new trend from the pivot. We can identify five fractals on an intraday chart. Wave 1 usually overbalances prior countertrend swings of the same degree in price and time. A Trading Trigger has occurred.

We may label this first swing as S1 instead of with a conventional Elliott Wave label.

This an alert signal only. No action taken. We use the extreme of Wave 1 to project price and time targets for Wave 2. Wave 1 can be an A wave. It is the first swing from a tradable pivot.

Three swing patterns occur frequently. Very often the third swing relates to the first by a multiple of .62 to 1.00. That often makes the third swing tradable even when the first swing's final status as an A wave or W.1 of a new trend is in doubt.

Wave 2 Entry (W2E)

The second swing must not exceed Wave Zero. We can identify three fractals on an intraday chart. Wave 2 has retraced at least 50% but not more than 79% of Wave 1. Wave 2 is usually >50% and <162% in time of Wave 1. A Trading Trigger has occurred.
This swing may be labeled as S2.

A Wave 2 entry is positioned for the upcoming Wave 3 or Wave C and what is usually the most profitable leg of the trade. Maximum stop loss point is Wave Zero. If a reversal bar of some type has not occurred to mark Wave 2 then the Trading Trigger will be a Continuation Bar signal after the suspected Wave 2 has moved in the new trend direction.

Wave 3 Potential (W3P)

Wave 3 has exceeded the level where W.3 = W.1. The price distance traveled by Wave 3 is greater than the price distance traveled by Wave 1.

Maximum stop loss levels can be raised to the extreme of Wave 2. The assumption is that once Wave 3 exceeds the distance of Wave 1 that the new trend is confirmed. If Wave 3 has completed five fractals and has not exceeded this level then there is a strong possibility that this wave is a Wave C reversal and not a new trend. Especially true if prices are still in the Yellow Zone.

Cleared Yellow Zone (CYZ)

The new swing has exceeded the .618 retracement level of the entire length of the last countertrend swing of the same degree.

The Yellow Zone is the 50%-62% retracement zone of the entire last countertrend swing. If, despite appearances, the new swing from Wave Zero is not impulsive in the direction of a new trend, the Yellow Zone is the most likely area where the swing will get killed.

Wave 3 Extension (W3E)

Wave 3 has exceed Wave 1 in price distance by 162% .

Trail stop loss point closer to the market. Wave 3 is commonly 162%-262 of Wave 1 and it is in the stage where it could come to an early and unexpected end.

Wave 3 Reversal Alert (W3RA)

Wave 3 has completed at least five fractals and is in a coincidence of a Price and Time Zone. A Trading Trigger has occurred.

The ending point of Wave 3 is often related to Wave 1 and Wave 2 in both price and time by certain Fibonacci multiples. Trailing stop loss point should be moved very close to the market.

Wave 4 Entry (W4E)

At least two down fractals have shown since Wave 3. The Swing Oscillator for the operative time frame (120 bars) has crossed zero. Wave 4 has not violated Wave 1. Usually Wave 4 will retrace >38% of Wave 3. Wave 4 alternates in pattern with Wave 2. Wave 4 is in a Price and Time Zone. Wave 4 is not overbalanced in time to previous waves of the same degree. Wave 4 has retraced at least 62% of the price range of Wave 2. A Trading Trigger has occurred.

The initial stop loss for the upcoming Wave 5 trade is the extreme of Wave 1. Wave 4s are often complex and the most frequent home of triangles and the dreaded "X" wave. Do not be overanxious to take a Wave 5 trade if Wave 4 has retraced more than 50% of Wave 3 or if it is so overbalanced in time that it exceeds the time consumed in any correction of one larger degree. On the other hand, if Wave 3 is easily identifiable as such and Wave 4 has retraced 38% or less of Wave 3 in a simple A-B-C, then new Wave 5 highs are very probable.

Wave 5 Reversal (W5R)

 Wave 5 has completed at least five fractals and is in a coincidence of a Price and Time Zone. A Trading Trigger has occurred.

W5R and RA are similar and often interchangeable. W5R is used when the Elliott Wave fractal pattern is a neat and clean five waves on all degrees.

When the extreme of Wave 3 is exceeded the maximum stop loss should be raised to Wave 4.

When four fractals are in place for Wave 5 trailing stops should be moved very close to the market.

 If Wave 4 has exceed >50% of Wave 3, the possibility of a 5th wave failure is increased.

REVERSAL BARS

Reversal bars are an objective technique used to time the entry of a trade. When pattern, price and time all come together at a suspected major pivot, and you hesitate while wondering if the prior trend will continue against your new position, a reversal bar can be the objective trigger to prompt you to take action. The examples demonstrated below have many variations. The example given is not the only possible configuration for that reversal bar type. The important concept is that with every configuration, prices make a new high (or low) but close opposite the direction of the open and the trend. The reversal bar is telling you that the trend for that time frame has run out of gas and that no new buyers or sellers are coming into the market. For bullish reversals just substitute low for high.

Not every reversal bar is significant. This is especially true for intraday charts. Reversal bars take on importance when they occur at a coincidence of pattern, price and time.

  • Reversal Bar


  • Key Reversal Bar


  • Outside Key Reversal Bar


  • Signal Bar


  • Gap Signal Bar


  • Snap Back Reversal Bar


  • Reversal Confirmation


CONTINUATION BARS

Not every major pivot point is marked by a reversal bar. Continuation set-ups can still get you in a trade relatively close to the pivot point. Continuation bars are easily identified on a bar or candlestick chart. They always start with either an inside bar or an outside bar.

Inside Bar - Today's high and low do not exceed yesterday's high and low.

Outside Bar - Today's high and low both exceed yesterday's high and low.

  • Inside Bar


  • Outside Bar

  • Outside Plus Bar


STOP LOSSES

Losses are part and parcel of trading. Successful traders learn to manage their losses, or shortly find something else to occupy their time.

Trade entries are relatively easy. You have an objective set of criteria and when those conditions are met you enter the trade. Stop losses are more difficult because now you are in the trade. The cool hand that pulled the trigger to enter is now firmly wedged between the rock of fear and the hard place of greed.

Just a few ideas for objective stop loss points. There are many more.

Pattern stops occur when price moves to an extreme that negates the working Elliott Wave scenario. For example, a Wave 2 entry is stopped out if prices violate the pivot price that initiated the swing (Wave Zero). All the pattern stops that we use are set out in the Trading Signals section.

Robert Miner, a successful trader and teacher, posits that three, two and one day bar extremes are logical stops. For example, for a long trade that is in the early stages of a Wave 3, the lowest low of the most recent three daily bars (including today) is an objective stop loss point. As Wave 3 progresses into its later stages the stop is moved to two bars or even to one bar. Miner does not count inside bars when computing the extremes.

Another method presented by Williams that ties into Miner's one day stop is the Zone Stop. When price bars have run for five consecutive bars in the same zone (shown as five consecutive red or green bars) place a one day stop and move it every day until it gets hit.

The important concept is to let the market, not your emotions, take you out of the trade - with a profit if the trade works out for you, and with a manageable loss if it does not. You don't know what the market is going to do next. Don't anticipate. You'll experience a lot less stress and probably make more money too.