Drawing Trendlines
Trading stocks information -
General tactics and examples
Trendlines are possibly the most useful and valuable
tool in the study of market trends. Trendlines are
utilized in chart analysis to determine the slope of the
market trend and assist in ascertaining when the trend
is changing. For the purposes of this explanation, up
trendlines and down trendlines will primarily be used.
Up trendlines are drawn under the rising stock chart
lows. Upward moving trendlines are drawn under the stock
connecting the dips to easily target a possible entry
point. Down trendlines are drawn above the declining
stock chart peaks. Downward moving trendlines are drawn
on top of the stock, connecting rallies to easily target
a shorting possibility. Markets rise and fall at a given
slope. Trendlines help traders determine the slope of a
given stock.
When drawing trendlines, draw the line from:
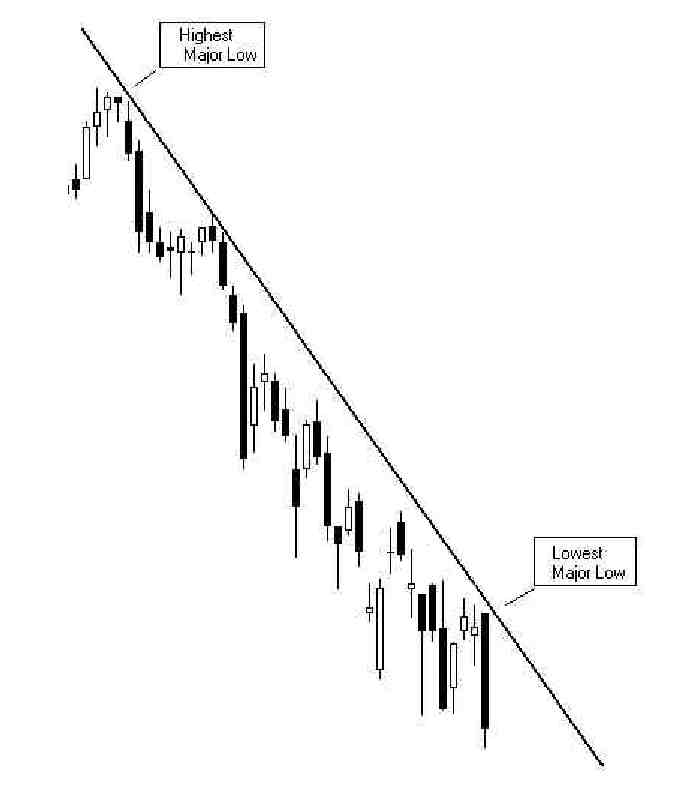
In a downtrend, the highest high to the highest high
PRECEDING THE LOWEST LOW.
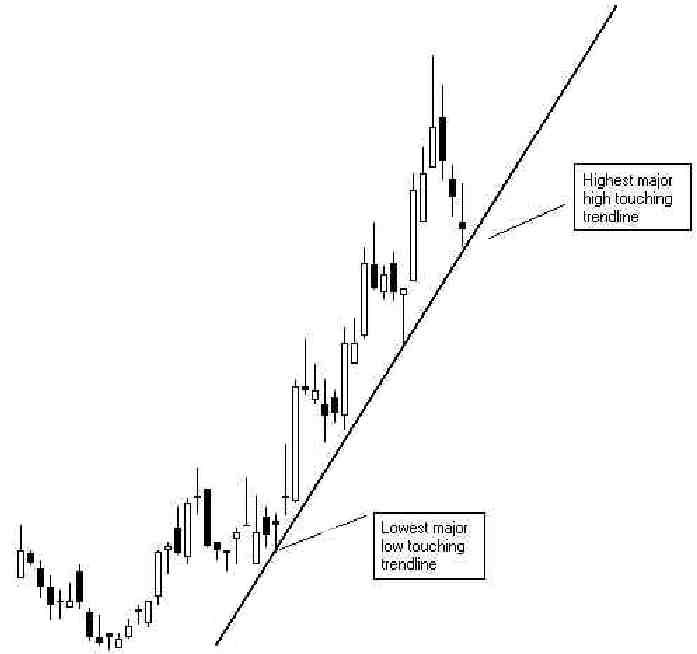
In an uptrend, the lowest low to the lowest low
PRECEDING THE HIGHEST HIGH.
When drawing valid trendlines, traders should watch for
the stock to bounce off it several times. For example,
in an uptrend markets will often pull back to the up
trendline and bounce off it and make a higher high.
Retests of an upward moving trendline often present
excellent buying opportunities. In a downtrend, stocks
will often rally up toward the falling trendline,
presenting traders with short selling opportunities. It
is significant when a trendline is touched at least
three times and is often followed by a major move.
Trendlines speak volumes when they
are violated, because the breaks signal major changes in
the trend’s direction. A break below an advancing
trendline is bearish or negative, while a break above a
declining trendline is bullish. It is also important to
realize that the greater the slope of a given trendline,
the less meaningful its break is on the downside. If you
have a very steep advancing trendline slope, a break
below that trendline may mean a stock is going to move
up at a slower rate of advance. It does not usually mean
the stock has stopped advancing. This is usually due to
the fact that the stock’s prior rate of advance was
simply not sustainable and needs to gather momentum to
move again. Conversely, the greater the slope of a down
trendline, the less meaningful its break is when it
moves to the upside. If you have a steep declining
trendline slope, a break above the trendline may mean
that a stock may move down at a lower rate of decline,
but this does not usually indicate that it has stopped
declining. The stock's prior rate of decline was simply
not sustainable.
|
DRAWING A PROPER UP
TRENDLINE |
|
DRAWING A PROPER DOWN
TRENDLINE |
Minor trendlines have shorter-term timeframes. Major
trendlines encompass longer-term timeframes. In any
given stock, a trader will be able to draw several minor
trendlines within a major trendline. The minor trendline
will help identify when and where the trend might
change, designating a trading opportunity. The closer a
trendline is to being flat or horizontal, the more
negative the implications are when it is broken on the
downside. The closer to horizontal the trendline is when
it’s broken on the upside, the more bullish or positive
the implications are. Also important to notice is that
the steeper the angle of descent of a declining
trendline, the less positive or bullish its implications
are when it is overcome. All this means is that the
stock is now going to decline at a slower rate of
descent.
When drawing trendlines it is important to capture at
least 90 to 95% of the prices. If a trader cannot
capture 90 to 95% of the prices because a new trend has
begun, the trader should begin the trendline one level
below in a downward line or one level above in an upward
line.
Trendlines, when drawn correctly and combined with other
market information, help a trader ascertain when to
enter and exit a trade.
|