Williams %R
Williams %R was developed by Larry Williams to indicate overbought and
oversold levels.
The indicator is very similar to Stochastic %K - except that Williams %R is
plotted using negative values ranging from 0 to -100. Details of the formula can
be found under
Construction.
The number of periods used to calculate Williams %R can be varied according
to the
time frame that you are trading. A rule of thumb is that the indicator
window should be half the length of the cycle (14 days is popular for the
intermediate cycle).
Overbought and Oversold levels are normally set at -20 and -80.
Trading Signals
Use
trailing buy- and sell-stops, to enter and exit trades, and protect yourself
with
stop-losses.
Long signals:
- Go long on bullish
divergence or
failure swing;
- Go long when Williams %R falls below the oversold level.
Short signals:
- Go short on bearish
divergence or
failure swing;
- Go short when Williams %R rises above the overbought level.
Example 1
Johnson and Johnson is displayed with
 7 day Williams
%R.
7 day Williams
%R.
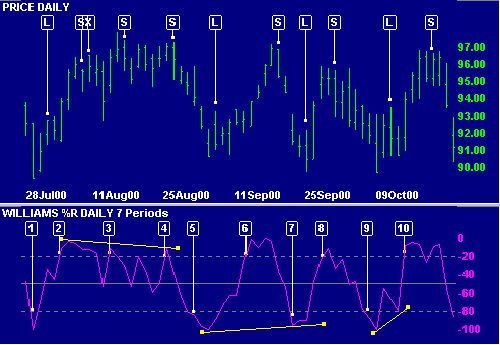
- Place a trailing buy-stop when Williams %R falls below the oversold line.
We are stopped in [L] when price rises above the previous day's High. Protect
your position with a stop-loss below the recent Low.
- Place a trailing sell-stop when %R rises above the overbought line. We are
stopped in [S] when price falls below yesterday's Low. The position is stopped
out [X] on the following day when price rises above the recent High.
- %R rises above the overbought level. Place a trailing sell-stop. A bearish
divergence supports the signal.
- A triple divergence adds further support for the short position.
- Place a trailing buy-stop when %R falls below -80. When stopped in [L],
place a stop-loss below the recent Low.
- Place a trailing sell-stop when %R rises above -20. When stopped in [S],
place a stop-loss above the recent High.
- Place a trailing buy-stop: the oversold signal is strengthened by a
bullish divergence.
- Place a trailing sell-stop.
- %R falls below the oversold level: place a trailing buy-stop. A failure
swing is completed when %R rises above the level of the intervening peak.
- Another signal to go short. Place a trailing sell-stop. We are stopped in
5 days later when price falls below the previous day's Low. Protect your
position with a stop-loss above the recent High.
Trending Markets
It is advisable to use a longer Williams %R period or some other form of
smoothing to reduce volatility and false signals.
Signals should only be taken when there is clear evidence that the trend has
reversed. One method of doing so is to wait until %R crosses the -50 level:
-
Go long when %R falls below the Oversold level then rises above -50.
-
Go short when %R rises above the Overbought level then falls below -50.
Alternatively, use a trend indicator for trend direction and exit signals.
Example 2
Johnson and Johnson with
 30 day
exponential moving average (MA) and
14 day Williams
%R: The chart shows a fairly strong up-trend, suitable for trading with
%R trend signals.
30 day
exponential moving average (MA) and
14 day Williams
%R: The chart shows a fairly strong up-trend, suitable for trading with
%R trend signals.
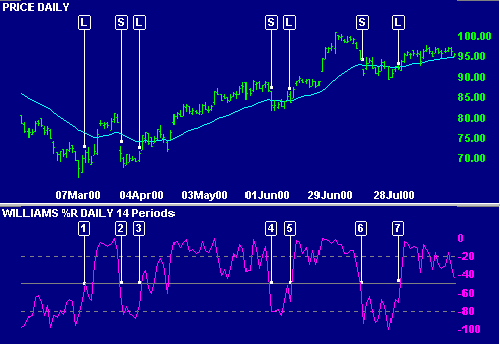
- Go long [L]: Williams %R rises from the oversold level to above -50.
- Go short [S] when %R falls below -50 from the overbought level.
- Go long [L] when %R rises above -50 from the oversold level.
- Go short [S]
- Go long [L]
- Go short [S]
- Go long [L]
Note that we are whipsawed fairly frequently if MA is used as the trend
indicator, even with closing price as a
filter.
Setup
The default Williams %R window is 14 days, with overbought/oversold levels
of -20% and -80% respectively. To alter the default settings -
Edit Indicator Settings.
See
Indicator Panel for directions on how to set up an indicator.
Related Topics
%R Construction
Williams %R is calculated using the high, low and close for the indicator
period...
External Links
Williams %R -- Chart School
Williams %R is a momentum indicator especially popular for measuring
overbought and oversold levels.
Williams' %R