The Slow Stochastic applies further smoothing to the Stochastic oscillator, to reduce volatility and improve signal accuracy.
Details of the formula can be found at Construction.
Trading signals are the same as for the Stochastic oscillator.
Signals are listed in order of their importance:
Short signals:
Place stop-losses below the most recent minor Low (or above the most recent minor High) when going long (or short).
Only take signals in the direction of the trend and never go long when Stochastic is overbought, nor short when oversold.
The shape of a Stochastic bottom gives some indication of the ensuing rally. A narrow bottom that is not very deep indicates that bears are weak and that the following rally should be strong. A broad, deep bottom signals that bears are strong and that the rally should be weak.
The same applies to Stochastic tops. Narrow tops indicate that the bulls are weak and that the correction is likely to be severe. High, wide tops indicate that bulls are strong and the correction is likely to be weak.
Use trailing buy- and sell-stops to enter trades and protect yourself with stop-losses.
If the Stochastic (%K or %D) falls below the Oversold line, place a trailing buy stop. When you are stopped in, place a stop loss below the Low of the recent down-trend (the lowest Low since the signal day).
If Stochastic rises above the Overbought line, place a trailing short stop. When you are stopped in, place a stop loss above the High of the recent up-trend (the highest High since the signal day).
Use a trend indicator to exit.
Johnson & Johnson is plotted with a ![]() 21 day
exponential moving average (MA) and 5 day Slow Stochastic with
21 day
exponential moving average (MA) and 5 day Slow Stochastic with![]() %K and
%K and![]() %D.
Overbought/oversold levels
%D.
Overbought/oversold levels ![]() are set at 70/30. Closing price is used as a
filter on the MA.
are set at 70/30. Closing price is used as a
filter on the MA.
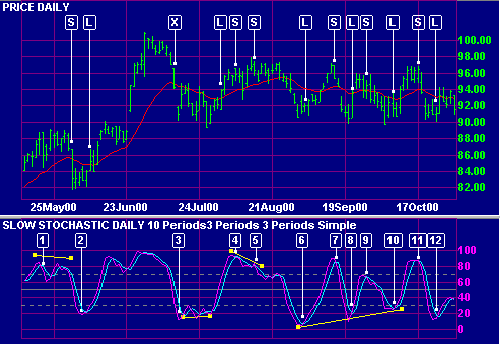
Remember that the days shown are the signal days and that trades are only entered on the following day. Take a look at the exit [X] from [2]. Adjusting Stop Levels may provide faster exits.
See Indicator Panel for directions on how to set up an indicator. The default Slow Stochastic settings are:
To alter default settings - see Edit Indicator Settings.
Stochastic Oscillator -- Chart School
The "Last" Stochastic Technique -- Chart School