Parabolic SAR
Parabolic SAR was developed by J. Welles Wilder Jr. and is described in his
book New Concepts in Technical Trading Systems. SAR stands for stop
and reverse.
Parabolic SAR should only be employed in trending markets - when it provides
excellent entry and exit points. It is plotted in a rather unorthodox fashion: a
stop loss is calculated for each day using the previous days data. The advantage
is that the stop level can be calculated in advance of the market opening.
- A stop level below the current price indicates that your position is long.
The stop will move up every day until activated (when price falls to the stop
level).
- A stop level above the current price indicates that your position is
short. The stop moves down every day until triggered (when price rises to the
stop level).
See
Construction for further details.
Trading Signals
Your first step is to confirm that the market is trending:
- Use a trend indicator, or
- Stop trading with the Parabolic SAR if you are whipsawed twice in a row
and re-commence after you observe a
breakout from the chart pattern.
A trade is signaled when the price bars and stop levels intersect:
-
Go long when price meets the Parabolic SAR stop level, while short.
-
Go short when price meets the Parabolic SAR stop level, while long.
Example
Microsoft Corporation plotted with
 Parabolic SAR and
 63-day
exponential moving average.
63-day
exponential moving average.
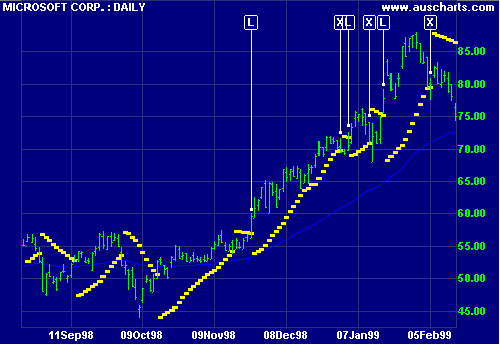
- Ignore signals while price is ranging (identified by the fluctuations
around the MA). Go long at [L] after price
respects the MA. Price then breaks out of the range, confirming our
signal.
- Exit [X] when price activates the Parabolic SAR stop.
Do not go short as the MA slopes upwards.
- Go long [L] when price crosses back above the stop. MA is still rising.
- Exit [X] when price falls to the stop level.
Do not go short as the MA slopes upwards.
- Go long [L] when price crosses back above the stop. MA is still rising.
- Exit [X] when price falls to the stop level.
Do not go short as the MA still slopes upwards.
In the original system, short signals are taken at each exit point [X],
resulting in unprofitable trades against the trend.
Setup
See
Indicator Panel for directions on how to set up Parabolic SAR on the price
chart. The default settings are an acceleration factor of 2% and a maximum step
of 20%. To alter the default settings - see
Edit Indicator Settings.
Related Topics
Parabolic SAR Construction
A complex formula designed to provide effective entry and exit points in
trending markets...
External Links
Parabolic SAR -- Chart School
Learn the How, the What, and the Where of technical analysis and stock
charting.
Technical
Analysis from A to Z
Parabolic SAR - Steve Achelis' best-selling book, Technical Analysis from A to
Z