MACD: Moving Average Convergence Divergence
The MACD is basically a refinement of the
two moving averages system and measures the distance between the two moving
average lines. Signals are taken when MACD crosses its signal line, calculated
as a 9 day
exponential moving average of MACD.
The indicator is primarily used to trade trends and should not be used in a
ranging market.
MACD was developed by Gerald Appel and is discussed in his book, The
Moving Average Convergence Divergence Trading Method. For further details,
see
MACD Construction.
Trading Signals
First check whether price is trending. If MACD is flat or stays close to the
zero line, the market is ranging and signals are unreliable.
Trending Market
-
Go
long
when the MACD line crosses the signal line from below.
-
Go
short when the MACD line crosses the signal line from above.
Signals are far stronger if there is either:
- a
divergence on the MACD line; or
- a large swing above or below the zero line.
Unless there is a divergence, do not go long if the signal is above the zero
line, nor go short if the signal is below zero.
Place
stop-losses below the last minor Low when long, or the last minor High when
short.
Example
Microsoft Corporation chart with:
 MACD, and
  MACD signal line.
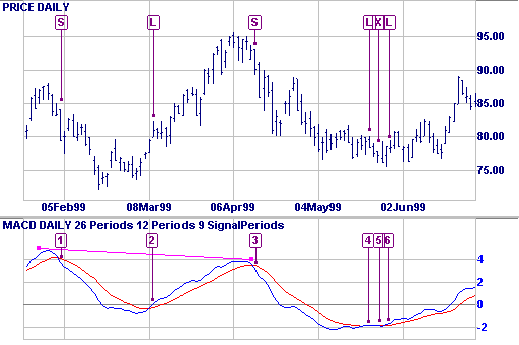

- Go short [S] - MACD crosses to below the signal line after a large swing.
- Go long [L] when MACD crosses to above the signal line.
- Strong short signal [S] - the MACD crosses after a large swing and bearish
divergence (shown by the
 trendline).
- Go long [L]. Flat MACD signals that the market is ranging - we are more
likely to be whipsawed in/out of our position.
- Exit long trade [X] but do not go short - MACD is significantly below the
zero line.
- Re-enter your long trade [L].
Setup
The default settings for the MACD are:
- Slow moving average - 26 days
- Fast moving average - 12 days
- Signal line - 9 day moving average of the difference between fast and
slow.
- All moving averages are
exponential.
Edit Indicator Settings to change the settings. See
Indicator Panel for directions on how to set up an indicator.
Captions and trendlines: Use MACD Histogram if you want to draw trendlines or
place captions on the histogram. Otherwise, they are left "hanging in the air"
if you zoom or change time periods.
Related Topics
Moving Averages
A powerful measure of trend direction, achieved by smoothing price data...
Two Moving Averages
Fast and slow moving averages provide a powerful measure of trend strength and
direction...
MACD
Histogram
The histogram provides far earlier and more responsive signals than the
original MACD. Unfortunately it is also more volatile...
MACD Construction
MACD is calculated as the difference between a fast (12-day) and slow (26-day)
moving average...
External Links
Divergence (MACD)
Moving Average Convergence/Divergence (MACD) -- Chart School
Learn the How, the What, and the Where of technical analysis and stock
charting.
MACD Part 1 -- Chart School
One of the simplest and most reliable indicators available, MACD uses moving
averages, which are lagging indicators, to include some trend-following
characteristics.
MACD Part 2 -- Chart School
One of the simplest and most reliable indicators available, MACD uses moving
averages, which are lagging indicators, to include some trend-following
characteristics.
MACD Part 3 -- Chart School
One of the simplest and most reliable indicators available, MACD uses moving
averages, which are lagging indicators, to include some trend-following
characteristics.
MACD Part 4 -- Chart School
MACD is one of the most popular and easy to use tools available to the
technical analyst. By using an average of prices, moving averages smooth a
data series and make it easier to spot trends.
MACD -
Technical Analysis from A to Z
MACD - Steve Achelis' best-selling book, Technical Analysis from A to Z
MACD