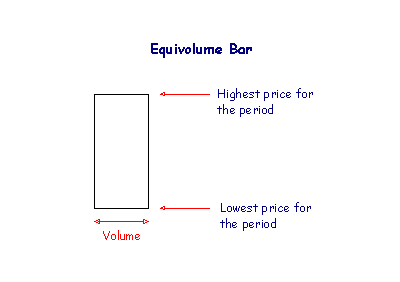
Volume plays an important role in confirming price movements. It is sometimes difficult to track this relationship on a normal bar chart with volume plotted in a separate slot below. This is overcome by plotting price and volume activity on a single chart.
Equivolume was invented by Richard W Arms Jr. and introduced in his book Volume Cycles in the Stock Market.
The height of each bar (or box) represents the trading range for the period - the highest and lowest prices recorded - while the width of the bar represents volume traded during the period.
We can tell a great deal about the commitment of buyers and sellers from the shape of the box.
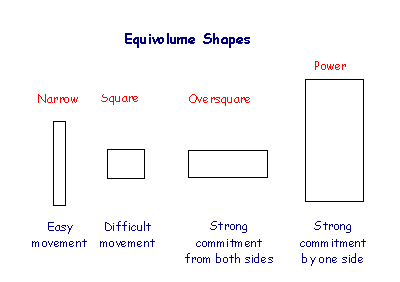
An oversquare day shows that buyers and sellers are both strongly committed to their positions. This is a powerful reversal signal after a strong trend. Power days show strong commitment by buyers in an up-trend (or sellers in a down-trend) and serve as confirmation of breakouts above resistance levels (or below support levels) in a chart pattern.
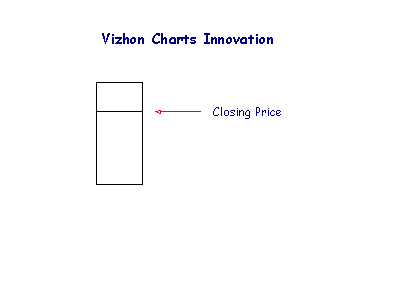
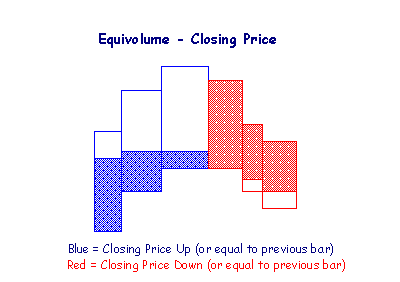
Closing Prices
Incredible Charts have added closing prices to Equivolume charts. The position of closing price in relation to the day's range indicates whether buyers or sellers have control.
In an up-trend:
In a down-trend:
Closing price is represented by a horizontal line across the bar.
So what's the big deal?
The key is that we have shaded the area above or below the closing price,
depending on whether the close is higher or lower than the previous day. This
enables you to tell at a glance whether a trend is strong or weakening.
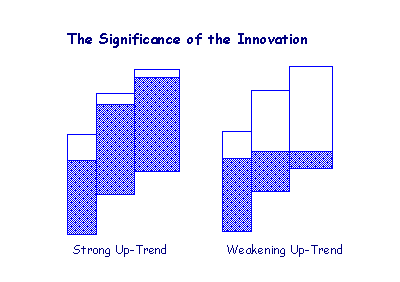
Bars that are mostly lighter shade signal that a trend is weakening.
So closing price is always the top border of the blue shaded area (green is used on some charts) or the bottom border of the red shaded area (in a down-trend). It sounds complicated but is easy to follow on the chart. Take a look at the figure below.
At the request of a number of users, Incredible Charts have now added Opening Price to equivolume bars. The default format now displays Open, High, Low and Close; similar to candlestick bars. The only difference is that the width of the bar depicts volume, and shadows are depicted by a lighter color shade. Take a look at the AMD chart below:
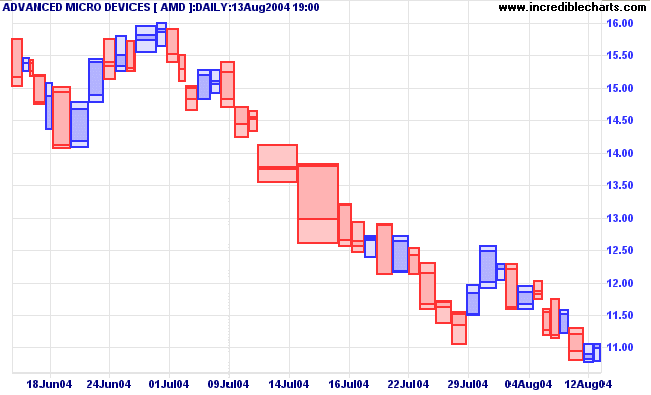

Default bar colors are:
Select View >> Advanced Options >> Display Equivolume HLC if you want to revert to the old format:
In the old format, equivolume bars are colored:
Equivolume
- Technical Analysis from A to Z