Three-Weeks-Tight Pattern Can Occur While A Sound Base Forms
This pattern often offers up a secondary buy point after a stock has broken out of a base. It can also occur while a base is still forming.
On a weekly chart, look for at least three weeks where the stock closes at nearly the same price. That indicates mutual funds and other big investors aren't eager to dump their shares, a constructive sign.
Mild swings in the weekly action needn't cause too much alarm. The stock might come off its high and close lower during the first two weeks, or sell off early but rally to close near its high. That's OK as long as the closes are close.
But don't buy shares just because you see a three-weeks-tight pattern while a base shapes. That by itself isn't a buy signal. Think of it as one trait of a potentially sound base. Always follow your buy rules and wait until the actual breakout.
For instance, if three weeks of tight closes or more occur at the handle or near the right side of the base and are followed by a big up day on heavy volume, that may signal a buy as long as the stock crosses above the ideal buy point.
But if the pattern shows up amid the base, don't pull the trigger.
As always, once you've bought shares on the breakout, adhere to your sell rules to help lock in profits. Keep watching the stock's daily and weekly charts. Perhaps you'll even get a chance to add a smaller number of shares if another three weeks tight forms after the breakout.
Coach
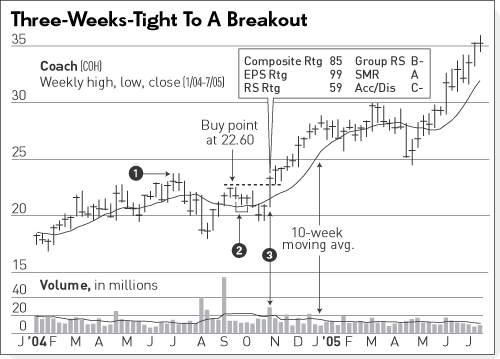
The stock marked an all-time high the week ended July 2, 2004 (point 1) before pulling back the next three weeks to start the left side of a new base. It fell as much as 24% from the left peak to the trough of the cup base, but quickly shaped the cup's right side in four weeks.
The week ended Sept. 17, it began forming the top of a handle before edging lower to close at 21.75 (adjusted for a 2-for-1 split in April this year). The next week the stock dipped lower but moved up to end at 21.55. That was followed by another weekly close at 21.55, completing a three-weeks-tight pattern (point 2).
Coach didn't break out right away. It lost some ground the next two weeks before turning up. The week ended Oct. 29, it vaulted 11%, shooting above its 22.60 buy point on heavy trade (point 3). Shares have rallied more than 55% since.
